Honda 2009 Annual Report Download - page 32
Download and view the complete annual report
Please find page 32 of the 2009 Honda annual report below. You can navigate through the pages in the report by either clicking on the pages listed below, or by using the keyword search tool below to find specific information within the annual report.-
 1
1 -
2
-
3
-
4
-
5
-
6
-
7
-
8
-
9
-
10
-
11
-
12
-
13
-
14
-
15
-
16
-
17
-
18
-
19
-
20
-
21
-
 22
22 -
 23
23 -
 24
24 -
 25
25 -
 26
26 -
 27
27 -
 28
28 -
 29
29 -
 30
30 -
 31
31 -
 32
32 -
 33
33 -
 34
34 -
 35
35 -
 36
36 -
 37
37 -
 38
38 -
 39
39 -
 40
40 -
 41
41 -
 42
42 -
43
-
44
-
45
-
46
-
47
-
48
-
49
-
50
-
51
-
52
-
53
-
54
-
55
-
56
-
57
-
58
-
59
-
60
-
61
-
62
-
63
-
64
-
65
-
66
-
67
-
68
-
69
-
70
-
71
-
72
-
73
-
74
-
75
-
76
-
77
-
78
-
79
-
80
-
81
-
82
-
83
-
84
-
85
-
86
-
87
-
88
-
89
-
90
-
91
-
92
 |
 |

3月31日に終了した各年度
Thousands
8,000
6,000
4,000
2,000
0
05 06 07 08
0
2000
4000
6000
8000
10000
12000
0
500
1000
1500
2000
2500
3000
3500
4000
0
1000
2000
3000
4000
5000
6000
0
100000
200000
300000
400000
500000
600000
09
Years ended March 31
Unit Sales
Years ended March 31
Yen (billions)
500
400
300
200
0
05 06 07 08
100
60
120
180
0
二輪
四輪
汎用
金融
0
300000
600000
900000
1200000
1500000
0
1000000
2000000
3000000
4000000
5000000
6000000
7000000
8000000
0
50000
100000
150000
200000
250000
300000
350000
0
100000
200000
300000
400000
500000
600000
09
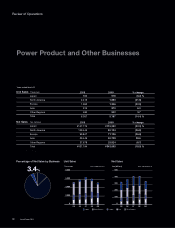
Net SalesPercentage of Net Sales by Business
3.4%
Japan North America Europe Asia Other Regions
0
2000
4000
6000
8000
10000
12000
0
500
1000
1500
2000
2500
3000
3500
4000
0
1000
2000
3000
4000
5000
6000
0
100000
200000
300000
400000
500000
600000
Unit Sales Thousands 2008 2009 % change
Japan 550 516 (6.2) %
North America 2,415 1,893 (21.6)
Europe 1,693 1,306 (22.9)
Asia 915 970 6.0
Other Regions 484 502 3.7
Total 6,057 5,187 (14.4) %
Net Sales Yen (millions) 2008 2009 % change
Japan ¥147,775 ¥115,252 (22.0) %
North America 109,445 80,124 (26.8)
Europe 96,847 71,126 (26.6)
Asia 39,449 50,739 28.6
Other Regions 27,678 25,824 (6.7)
Total ¥421,194 ¥343,065 (18.5) %
Years ended March 31
Annual Report 2009
30
Power Product and Other Businesses
Review of Operations