Honda 2009 Annual Report Download - page 8
Download and view the complete annual report
Please find page 8 of the 2009 Honda annual report below. You can navigate through the pages in the report by either clicking on the pages listed below, or by using the keyword search tool below to find specific information within the annual report.-
 1
1 -
 2
2 -
 3
3 -
 4
4 -
 5
5 -
 6
6 -
 7
7 -
 8
8 -
 9
9 -
 10
10 -
 11
11 -
 12
12 -
 13
13 -
 14
14 -
 15
15 -
 16
16 -
 17
17 -
 18
18 -
 19
19 -
20
-
21
-
22
-
23
-
24
-
25
-
26
-
27
-
28
-
29
-
30
-
31
-
32
-
33
-
34
-
35
-
36
-
37
-
38
-
39
-
40
-
41
-
42
-
43
-
44
-
45
-
46
-
47
-
48
-
49
-
50
-
51
-
52
-
53
-
54
-
55
-
56
-
57
-
58
-
59
-
60
-
61
-
62
-
63
-
64
-
65
-
66
-
67
-
68
-
69
-
70
-
71
-
72
-
73
-
74
-
75
-
76
-
77
-
78
-
79
-
80
-
81
-
82
-
83
-
84
-
85
-
86
-
87
-
88
-
89
-
90
-
91
-
92
 |
 |

12,000
10,000
8,000
6,000
4,000
2,000
0
1,000
7
5
0
500
250
0
120
100
80
60
40
20
0
600
450
300
150
0
12,500
10,000
7,500
5,000
2,500
0
600
400
200
0
10.0
7.5
5.0
2.5
0
20.0
15.0
10.0
5.0
0
2,500
2,000
1,500
1,000
500
0
05 06 07 08 09 05 06 07 08 09 05 06 07 08 09
05 06 07 08 09
05 06 07 08 0905 06 07 08 09
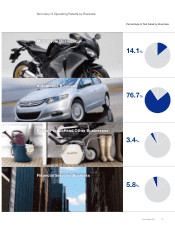
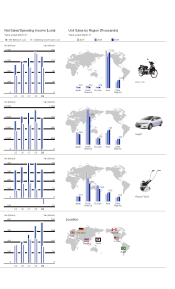
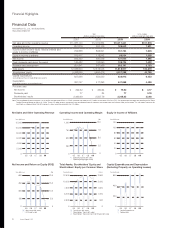
Net Sales and Other Operating Revenue Operating Income and Operating Margin Equity in Income of Affiliates
Net Income and Return on Equity (ROE) Total Assets, Stockholders’ Equity and
Stockholders’ Equity per Common Share
Capital Expenditures and Depreciation
(Excluding Property on Operating Leases)
Operating Income (left scale)
Operating Margin (right scale)
Net Income (left scale)
ROE (right scale)
Total Assets (left scale)
Stockholders’ Equity (left scale)
Capital Expenditures
Depreciation
Stockholders’ Equity per Common Share (right scale)
Yen
(millions except per share data)
U.S. dollars
(millions except per share data)
2007 2008 2009 2009
Net sales and other operating revenue ¥11,087,140 ¥12,002,834 ¥10,011,241 $101,916
Operating income 851,879 953,109 189,643 1,931
Income before income taxes, minority interest and
equity in income of affiliates 792,868 895,841 161,734 1,646
Equity in income of affiliates 103,417 118,942 99,034 1,008
Net income 592,322 600,039 137,005 1,395
Cash dividends paid during the period 140,482 152,590 139,724 1,422
Research and development 551,847 587,959 563,197 5,733
Total assets 12,036,500 12,615,543 11,818,917 120,319
Stockholders’ equity 4,488,825 4,550,479 4,007,288 40,795
Capital expenditures
(excluding purchase of operating lease assets) 627,066 654,030 633,913 6,453
Depreciation
(excluding property on operating leases) 361,747 417,393 441,868 4,498
Per share data
Net income ¥ 324.62 ¥ 330.54 ¥ 75.50 $ 0.77
Dividends paid 77 84 77 0.78
Stockholders’ equity 2,463.69 2,507.79 2,208.35 22.48
Financial Data
Note: The consolidated financial statements as of and for the year ended March 31, 2009, have been translated into U.S. dollars at the rate of ¥98.23=U.S.$1, the approximate exchange rate prevailing on the Tokyo
Foreign Exchange Market on March 31, 2009. Those U.S. dollar amounts presented in the consolidated financial statements and related notes are included solely for the reader. This translation should not be
construed as a representation that all the amounts shown could be converted into U.S. dollars.
Honda Motor Co., Ltd., and Subsidiaries
Years ended March 31
Financial Highlights
Annual Report 2009
6