Honda 2009 Annual Report Download - page 52
Download and view the complete annual report
Please find page 52 of the 2009 Honda annual report below. You can navigate through the pages in the report by either clicking on the pages listed below, or by using the keyword search tool below to find specific information within the annual report.-
 1
1 -
2
-
3
-
4
-
5
-
6
-
7
-
8
-
9
-
10
-
11
-
12
-
13
-
14
-
15
-
16
-
17
-
18
-
19
-
20
-
21
-
22
-
23
-
24
-
25
-
26
-
27
-
28
-
29
-
30
-
31
-
32
-
33
-
34
-
35
-
36
-
37
-
38
-
39
-
40
-
41
-
 42
42 -
 43
43 -
 44
44 -
 45
45 -
 46
46 -
 47
47 -
 48
48 -
 49
49 -
 50
50 -
 51
51 -
 52
52 -
 53
53 -
 54
54 -
 55
55 -
 56
56 -
 57
57 -
 58
58 -
 59
59 -
 60
60 -
 61
61 -
 62
62 -
63
-
64
-
65
-
66
-
67
-
68
-
69
-
70
-
71
-
72
-
73
-
74
-
75
-
76
-
77
-
78
-
79
-
80
-
81
-
82
-
83
-
84
-
85
-
86
-
87
-
88
-
89
-
90
-
91
-
92
 |
 |

Financial Review
Operating and Financial Review
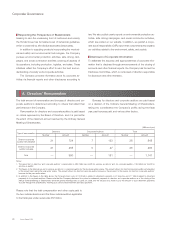
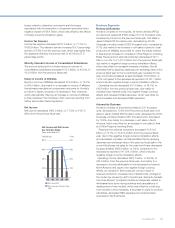
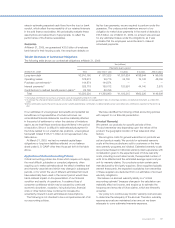
Net Sales and Other Operating Revenue
Honda’s consolidated net sales and other operating revenues
(hereafter, “net sales”) for the fi scal year ended March 31,
2009, decreased ¥1,991.5 billion, or 16.6%, to ¥10,011.2
billion from the fi scal year ended March 31, 2008, primarily due
to foreign currency translation effects and decreased net sales
in the automobile business. Honda estimates that by applying
Japanese yen exchange rates of the previous fi scal year to the
current fi scal year, net sales for the year would have decreased
by approximately ¥795.8 billion, or 6.6%, compared to the
decrease as reported of ¥1,991.5 billion, which includes
negative foreign currency translation effects.
Net sales in Japan decreased ¥139.2 billion, or 8.8%, to
¥1,446.5 billion from the previous fi scal year and overseas net
sales decreased ¥1,852.3 billion, or 17.8%, to ¥8,564.7 billion
from the previous fi scal year.
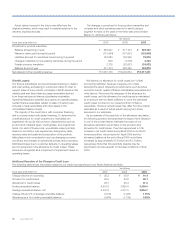
Operating Income
Operating income decreased ¥763.4 billion, or 80.1%, to
¥189.6 billion from the previous fi scal year. Excluding negative
foreign currency effects of ¥269.5 billion, caused by the
appreciation of the Japanese yen, Honda estimates operating
income decreased ¥493.8 billion, or 51.8%.
Factors contributing to the decrease of ¥493.8 billion in
operating income excluding negative foreign currency effects
can be summarized as follows (i) changes in net sales and the
model mix, (ii) cost reductions and the effect of raw material
cost fl uctuations, (iii) changes in selling, general and
administrative (SG&A) expenses and (iv) R&D expenses. Details
regarding these factors are as follows.
Changes in net sales and the model mix had a negative
impact of ¥247.7 billion, due mainly to a decrease in income
attributable to the decreased net sales and changes in the
model mix caused by shift of customers’ demands towards
more fuel effi cient (compact) models in automobile business,
which was offset by price increases and reduced sales
incentives in automobile business in North America.
Cost reductions and the effect of raw material fl uctuations
had a negative impact of ¥182.5 billion, due mainly to
increased raw materials costs, such as steel and precious
grade metals, and an increase in fi xed costs per unit as a result
of reduced production, which was offset by continuing cost
reductions.
Selling, general and administrative expenses had a negative
impact of ¥88.3 billion due mainly to expenses related to
withdrawal from some racing activities and cancellations of
development new models and an increase in provisions for
credit losses and losses on lease residual values in the fi nancial
services business in North America, which was offset by a
decrease in costs for product warranties.
R&D expenses also had a positive impact of ¥24.7 billion,
due mainly to reduction of R&D expenses, which was offset by
increased R&D expenses related to safety and environmental
technologies and enhancement of the attractiveness of the
products.
With respect to the discussion above of the changes in
operating income, management identifi ed the factors set forth
below and used what it believes to be a reasonable method to
analyze the respective changes in such factors. Each of these
factors is explained below. Management analyzed changes in
these factors at the levels of the Company and its material
consolidated subsidiaries.
(1) “Foreign currency effects” consist of “translation
adjustments”, which come from the translation of the
currency of foreign subsidiaries’ fi nancial statements into
Japanese yen, and “foreign currency adjustments”, which
result from foreign-currency-denominated sales. With
respect to “foreign currency adjustments”, management
analyzed foreign currency adjustments primarily related to
the following currencies: U.S. dollar, Canadian dollar, Euro,
British pound, Brazilian real and Japanese yen, at the level
of the Company and its material consolidated subsidiaries.
(2) With respect to “cost reduction and effects of raw material
cost fl uctuations”, management analyzed cost reduction
and effects of raw material cost fl uctuations at the levels of
the Company and its material foreign manufacturing
subsidiaries in North America, Europe and other regions.
(3) With respect to “changes in net sales and the model mix”,
management analyzed changes in sales volume and the mix
of product models sold in major markets which resulted in
increases/decreases in profi t, as well as certain other
reasons for increases/decreases in net sales and cost of
sales.
(4) With respect to “selling, general and administrative
expenses”, management analyzed reasons for increases/
decreases in selling, general and administrative expenses
from the previous fi scal year excluding currency translation
effects.
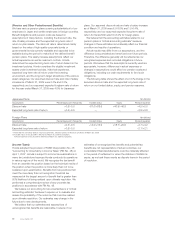
Income before Income Taxes, Minority Interest and
Equity in Income of Affi liates
Income before income taxes, minority interest and equity in
income of affi liates decreased ¥734.1 billion, or 81.9%, to
¥161.7 billion. Main factors of this decrease, except factors
relating to operating income, are as follows;
Unrealized gains and losses related to derivative instruments,
such as interest rate swaps of fi nance subsidiaries, had a
positive impact of ¥85.7 billion. On the other hand, realized
0
2,000
4,000
6,000
8,000
10,000
12,000
0908070605
Net Sales and Other Operating
Revenue
Years ended March 31
Yen (billions)
Annual Report 2009
50