Honda 2009 Annual Report Download - page 36
Download and view the complete annual report
Please find page 36 of the 2009 Honda annual report below. You can navigate through the pages in the report by either clicking on the pages listed below, or by using the keyword search tool below to find specific information within the annual report.-
 1
1 -
2
-
3
-
4
-
5
-
6
-
7
-
8
-
9
-
10
-
11
-
12
-
13
-
14
-
15
-
16
-
17
-
18
-
19
-
20
-
21
-
22
-
23
-
24
-
25
-
 26
26 -
 27
27 -
 28
28 -
 29
29 -
 30
30 -
 31
31 -
 32
32 -
 33
33 -
 34
34 -
 35
35 -
 36
36 -
 37
37 -
 38
38 -
 39
39 -
 40
40 -
 41
41 -
 42
42 -
 43
43 -
 44
44 -
 45
45 -
 46
46 -
47
-
48
-
49
-
50
-
51
-
52
-
53
-
54
-
55
-
56
-
57
-
58
-
59
-
60
-
61
-
62
-
63
-
64
-
65
-
66
-
67
-
68
-
69
-
70
-
71
-
72
-
73
-
74
-
75
-
76
-
77
-
78
-
79
-
80
-
81
-
82
-
83
-
84
-
85
-
86
-
87
-
88
-
89
-
90
-
91
-
92
 |
 |

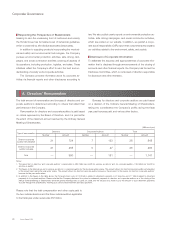
Note: The finance subsidiaries—receivables category above includes items that have been reclassified as trade receivables and other assets.
Yen (billions)
05 06 07 08
600
450
300
150
0
0
2000
4000
6000
8000
10000
12000
0
500
1000
1500
2000
2500
3000
3500
4000
0
1000
2000
3000
4000
5000
6000
0
100000
200000
300000
400000
500000
600000
09
Years ended March 31
Net Sales
Years ended March 31
Yen (billions)
05 06 07 08
60
120
180
0
6,000
4,500
3,000
1,500
0
二輪
四輪
汎用
金融
0
300000
600000
900000
1200000
1500000
0
1000000
2000000
3000000
4000000
5000000
6000000
7000000
8000000
0
50000
100000
150000
200000
250000
300000
350000
0
100000
200000
300000
400000
500000
600000
09
Finance Subsidiaries —
Receivables, Net
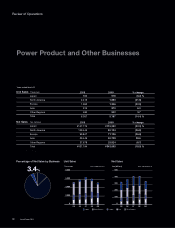
Percentage of Net Sales by Business
5.8%
Japan North America Europe Asia Other Regions
0
2000
4000
6000
8000
10000
12000
0
500
1000
1500
2000
2500
3000
3500
4000
0
1000
2000
3000
4000
5000
6000
0
100000
200000
300000
400000
500000
600000
60
120
180
0
二輪
四輪
汎用
金融
Non-current Current
0
300000
600000
900000
1200000
1500000
0
1000000
2000000
3000000
4000000
5000000
6000000
7000000
8000000
0
50000
100000
150000
200000
250000
300000
350000
0
100000
200000
300000
400000
500000
600000
Net Sales Yen (millions) 2008 2009 % change
Japan ¥ 23,405 ¥ 24,083 2.9 %
North America 483,925 527,905 9.1
Europe 13,234 12,685 (4.1)
Asia 4,936 4,736 (4.1)
Other Regions 8,053 12,852 59.6
Total ¥533,553 ¥582,261 9.1 %
Finance Subsidiaries —
Receivables, Net Yen (millions) 2008 2009 % change
Non-current ¥2,884,264 ¥2,571,152 (10.9)%
Current 1,817,033 1,596,642 (12.1)
Total ¥4,701,297 ¥4,167,794 (11.4)%
Years ended March 31
Annual Report 2009
34
Financial Services Business
Review of Operations