Honda 2009 Annual Report Download - page 79
Download and view the complete annual report
Please find page 79 of the 2009 Honda annual report below. You can navigate through the pages in the report by either clicking on the pages listed below, or by using the keyword search tool below to find specific information within the annual report.-
 1
1 -
2
-
3
-
4
-
5
-
6
-
7
-
8
-
9
-
10
-
11
-
12
-
13
-
14
-
15
-
16
-
17
-
18
-
19
-
20
-
21
-
22
-
23
-
24
-
25
-
26
-
27
-
28
-
29
-
30
-
31
-
32
-
33
-
34
-
35
-
36
-
37
-
38
-
39
-
40
-
41
-
42
-
43
-
44
-
45
-
46
-
47
-
48
-
49
-
50
-
51
-
52
-
53
-
54
-
55
-
56
-
57
-
58
-
59
-
60
-
61
-
62
-
63
-
64
-
65
-
66
-
67
-
68
-
 69
69 -
 70
70 -
 71
71 -
 72
72 -
 73
73 -
 74
74 -
 75
75 -
 76
76 -
 77
77 -
 78
78 -
 79
79 -
 80
80 -
 81
81 -
 82
82 -
 83
83 -
 84
84 -
 85
85 -
 86
86 -
 87
87 -
 88
88 -
 89
89 -
90
-
91
-
92
 |
 |

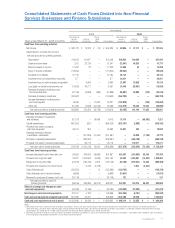
Consolidated Statements of Cash Flows Divided into Non-Financial
Services Businesses and Finance Subsidiaries
Yen (millions)
2008 2009
Years ended March 31, 2008 and 2009
Non-fi nancial
services
businesses
Finance
subsidiaries
Recon-
ciling
items Consolidated
Non-fi nancial
services
businesses
Finance
subsidiaries
Recon-
ciling
items Consolidated
Cash fl ows from operating activities:
Net income ¥ 580,728 ¥ 19,323 ¥ (12) ¥ 600,039 ¥ 89,894 ¥ 47,111 ¥ — ¥ 137,005
Adjustments to reconcile net income to
net cash provided by operating activities:
Depreciation 416,438 101,987 — 518,425 438,320 199,324 — 637,644
Deferred income taxes 7,612 23,729 — 31,341 (12,547) 54,320 — 41,773
Minority interests in income 27,280 28 — 27,308 13,886 42 — 13,928
Equity in income of affi liates (118,942) — — (118,942) (99,034) — — (99,034)
Dividends from affi liates 67,764 — — 67,764 65,140 — — 65,140
Impairment loss on investments in securities 577 — — 577 26,001 — — 26,001
Impairment loss on long-lived assets and goodwill
— 5,850 — 5,850 21,597 18,528 — 40,125
Loss (gain) on derivative instruments, net (14,020) 84,271 — 70,251 24,045 (39,551) — (15,506)
Decrease (increase) in trade accounts
and notes receivable (57,164) (9,996) (536) (67,696) (55,881) 25,995 (139) (30,025)
Decrease (increase) in inventories (100,622) — — (100,622) (262,782) — — (262,782)
Increase (decrease) in trade accounts
and notes payable 19,299 — 13,028 32,327 (132,909) — (753) (133,662)
Other, net 107,049 (4,508) (42,245) 60,296 (144,915) 95,425 12,524 (36,966)
Net cash provided by operating activities 935,999 220,684 (29,765) 1,126,918 (29,185) 401,194 11,632 383,641
Cash fl ows from investing activities:
Decrease (increase) in investments
and advances (87,073) — 96,486 9,413 75,714 — (68,393) 7,321
Capital expenditures (667,601) (627) — (668,228) (632,191) (2,999) — (635,190)
Proceeds from sales of property,
plant and equipment 26,476 392 — 26,868 18,501 342 — 18,843
Decrease (increase) in fi nance
subsidiaries—receivables — (227,525) (14,442) (241,967) — 45,509 (1,736) 43,773
Purchase of operating lease assets — (839,261) — (839,261) — (668,128) — (668,128)
Proceeds from sales of operating lease assets — 26,776 — 26,776 — 100,017 — 100,017
Net cash used in investing activities (728,198) (1,040,245) 82,044 (1,686,399) (537,976) (525,259) (70,129) (1,133,364)
Cash fl ows from fi nancing activities:
Increase (decrease) in short-term debt, net 98,926 548,993 (45,962) 601,957 452,437 (243,690) 62,048 270,795
Proceeds from long-term debt 32,387 1,032,504 (3,099) 1,061,792 63,253 1,250,961 (14,230) 1,299,984
Repayment of long-term debt (24,918) (760,750) 2,919 (782,749) (23,165) (879,541) 13,223 (889,483)
Proceeds from issuance of common stock — 6,149 (6,149) — — 2,544 (2,544) —
Cash dividends paid (152,602) — 12 (152,590) (139,724) — — (139,724)
Cash dividends paid to minority interests (9,663) — — (9,663) (10,841) — — (10,841)
Payment for purchase of treasury stock, net (30,746) — — (30,746) 131 — — 131
Net cash provided by (used in)
fi nancing activities (86,616) 826,896 (52,279) 688,001 342,091 130,274 58,497 530,862
Effect of exchange rate changes on cash
and cash equivalents (20,028) (3,136) — (23,164) (129,282) (12,390) — (141,672)
Net change in cash and cash equivalents 101,157 4,199 — 105,356 (354,352) (6,181) — (360,533)
Cash and cash equivalents at beginning of period
921,309 24,237 — 945,546 1,022,466 28,436 — 1,050,902
Cash and cash equivalents at end of period ¥1,022,466 ¥ 28,436 ¥— ¥1,050,902 ¥ 668,114 ¥ 22,255 ¥— ¥ 690,369
Notes:
1. Non-fi nancial services businesses lend to fi nance subsidiaries. These cash fl ows are included in the decrease (increase) in investments and advances, increase (decrease) in
short-term debt, proceeds from long-term debt, and repayment of long-term debt. The amount of the loans to fi nance subsidiaries is a ¥90,337 million increase for the fi scal year
ended March 31, 2008, and a ¥70,937 million decrease for the fi scal year ended March 31, 2009, respectively.
2. Decrease (increase) in trade accounts and notes receivable for fi nance subsidiaries is due to the reclassifi cation of fi nance subsidiaries—receivables which relate to sales of inventory
in the unaudited consolidated statements of cash fl ows presented above.
Annual Report 2009 77