Honda 2009 Annual Report Download - page 80
Download and view the complete annual report
Please find page 80 of the 2009 Honda annual report below. You can navigate through the pages in the report by either clicking on the pages listed below, or by using the keyword search tool below to find specific information within the annual report.-
 1
1 -
2
-
3
-
4
-
5
-
6
-
7
-
8
-
9
-
10
-
11
-
12
-
13
-
14
-
15
-
16
-
17
-
18
-
19
-
20
-
21
-
22
-
23
-
24
-
25
-
26
-
27
-
28
-
29
-
30
-
31
-
32
-
33
-
34
-
35
-
36
-
37
-
38
-
39
-
40
-
41
-
42
-
43
-
44
-
45
-
46
-
47
-
48
-
49
-
50
-
51
-
52
-
53
-
54
-
55
-
56
-
57
-
58
-
59
-
60
-
61
-
62
-
63
-
64
-
65
-
66
-
67
-
68
-
69
-
 70
70 -
 71
71 -
 72
72 -
 73
73 -
 74
74 -
 75
75 -
 76
76 -
 77
77 -
 78
78 -
 79
79 -
 80
80 -
 81
81 -
 82
82 -
 83
83 -
 84
84 -
 85
85 -
 86
86 -
 87
87 -
 88
88 -
 89
89 -
 90
90 -
91
-
92
 |
 |

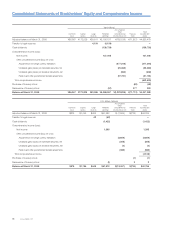
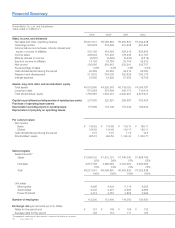
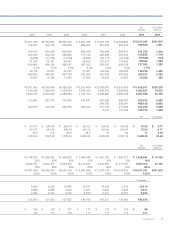
Financial Summary
Honda Motor Co., Ltd. and Subsidiaries
Years ended or at March 31
1999 2000 2001 2002
Sales, income, and dividends
Net sales and other operating revenue ¥6,231,041 ¥6,098,840 ¥6,463,830 ¥7,362,438
Operating income 540,978 418,639 401,438 661,202
Income before income taxes, minority interest and
equity in income of affi liates 523,168 419,658 388,419 555,854
Income taxes 229,624 170,434 178,439 231,150
Minority interest in income (2,657) (3,595) (3,443) (4,512)
Equity in income of affi liates 14,158 16,786 25,704 42,515
Net income 305,045 262,415 232,241 362,707
As percentage of sales 4.9% 4.3% 3.6% 4.9%
Cash dividends paid during the period 20,463 20,463 22,412 24,360
Research and development 311,632 334,036 352,829 395,176
Interest expense 27,890 18,920 21,400 16,769
Assets, long-term debt, and stockholders’ equity
Total assets ¥5,073,660 ¥4,935,976 ¥5,719,020 ¥7,064,787
Long-term debt 673,084 574,566 368,173 716,614
Total stockholders’ equity 1,763,855 1,930,373 2,230,291 2,573,941
Capital expenditures
(excluding purchase of operating lease assets)
237,080 222,891 285,687 303,424
Purchase of operating lease assets
Depreciation
(excluding property on operating leases)
177,666 172,139 170,342 194,944
Depreciation of property on operating leases
Per common share
Net income:
Basic ¥ 156.52 ¥ 134.65 ¥ 119.17 ¥ 186.11
Diluted 156.52 134.65 119.17 186.11
Cash dividends paid during the period 10.5 10.5 11.5 12.5
Stockholders’ equity 905.10 990.53 1,144.43 1,320.77
Sales progress
Sales amounts:*
Japan ¥1,556,333 ¥1,612,191 ¥1,740,340 ¥1,868,746
25% 26% 27% 25%
Overseas 4,674,708 4,486,649 4,723,490 5,493,692
75% 74% 73% 75%
Total ¥6,231,041 ¥6,098,840 ¥6,463,830 ¥7,362,438
100% 100% 100% 100%
Unit sales:
Motorcycles 4,295 4,436 5,118 6,095
Automobiles 2,333 2,473 2,580 2,666
Power Products 3,412 4,057 3,884 3,926
Number of employees 112,200 112,400 114,300 120,600
Exchange rate (yen amounts per U.S. dollar)
Rates for the period-end ¥ 121 ¥ 106 ¥ 124 ¥ 133
Average rates for the period 128 112 111 125
*The geographic breakdown of sales amounts is based on the location of customers.
Annual Report 2009
78