Honda 2009 Annual Report Download - page 6
Download and view the complete annual report
Please find page 6 of the 2009 Honda annual report below. You can navigate through the pages in the report by either clicking on the pages listed below, or by using the keyword search tool below to find specific information within the annual report.-
 1
1 -
 2
2 -
 3
3 -
 4
4 -
 5
5 -
 6
6 -
 7
7 -
 8
8 -
 9
9 -
 10
10 -
 11
11 -
 12
12 -
 13
13 -
 14
14 -
 15
15 -
 16
16 -
 17
17 -
18
-
19
-
20
-
21
-
22
-
23
-
24
-
25
-
26
-
27
-
28
-
29
-
30
-
31
-
32
-
33
-
34
-
35
-
36
-
37
-
38
-
39
-
40
-
41
-
42
-
43
-
44
-
45
-
46
-
47
-
48
-
49
-
50
-
51
-
52
-
53
-
54
-
55
-
56
-
57
-
58
-
59
-
60
-
61
-
62
-
63
-
64
-
65
-
66
-
67
-
68
-
69
-
70
-
71
-
72
-
73
-
74
-
75
-
76
-
77
-
78
-
79
-
80
-
81
-
82
-
83
-
84
-
85
-
86
-
87
-
88
-
89
-
90
-
91
-
92
 |
 |

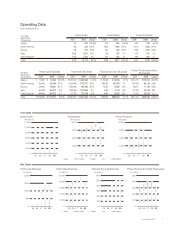
Yen (billions) Yen (billions)
1,600
1,200
800
400
0
05 06 07 08 09
160
120
80
40
0
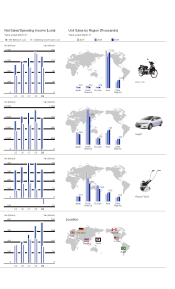
Japan AsiaEurope Other
Regions
North
America
276
7,523
232
1,763
320
8,000
2,000
4,000
8,000
2,000
4,000
2007 2008 2009
Japan AsiaEurope Other
Regions
North
America
350
793
556
322
1,496
8,000
2,000
4,000
Japan AsiaEurope Other
Regions
North
America
1,306
970
516 502
1,893
8,000
2,000
4,000
Germany
Thailand Japan
Brazil
U.S.A.
Canada
U.K.
8,000
2,000
4,000
Yen (billions) Yen (billions)
10,000
7,500
5,000
2,500
0
05 06 07 08 09
1,000
750
500
250
0
Yen (billions) Yen (billions)
80
60
40
20
0
400
300
200
100
0
-100 -20
05 06 07 08 09
Yen (billions) Yen (billions)
05 06 07 08 09
600
450
300
150
0
200
150
100
50
0
Net Sales/Operating Income (Loss) Unit Sales by Region (Thousands)
CZ-i 110
Insight
Pianta FV200
Location
Net Sales (left scale) Operating Income (right scale)
Years ended March 31 Years ended March 31