Honda 2009 Annual Report Download - page 63
Download and view the complete annual report
Please find page 63 of the 2009 Honda annual report below. You can navigate through the pages in the report by either clicking on the pages listed below, or by using the keyword search tool below to find specific information within the annual report.-
 1
1 -
2
-
3
-
4
-
5
-
6
-
7
-
8
-
9
-
10
-
11
-
12
-
13
-
14
-
15
-
16
-
17
-
18
-
19
-
20
-
21
-
22
-
23
-
24
-
25
-
26
-
27
-
28
-
29
-
30
-
31
-
32
-
33
-
34
-
35
-
36
-
37
-
38
-
39
-
40
-
41
-
42
-
43
-
44
-
45
-
46
-
47
-
48
-
49
-
50
-
51
-
52
-
 53
53 -
 54
54 -
 55
55 -
 56
56 -
 57
57 -
 58
58 -
 59
59 -
 60
60 -
 61
61 -
 62
62 -
 63
63 -
 64
64 -
 65
65 -
 66
66 -
 67
67 -
 68
68 -
 69
69 -
 70
70 -
 71
71 -
 72
72 -
 73
73 -
74
-
75
-
76
-
77
-
78
-
79
-
80
-
81
-
82
-
83
-
84
-
85
-
86
-
87
-
88
-
89
-
90
-
91
-
92
 |
 |

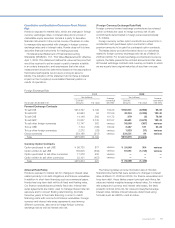
(Interest Rate Risks)
Honda is exposed to market risk for changes in interest rates
related primarily to its debt obligations and fi nance receivables.
In addition to short-term fi nancing such as commercial paper,
Honda has long-term debt with both fi xed and fl oating rates.
Our fi nance receivables are primarily fi xed rate. Interest rate
swap agreements are mainly used to manage interest rate risk
exposure and to convert fl oating rate fi nancing (normally
three-fi ve years) to fi xed rate fi nancing in order to match
fi nancing costs with income from fi nance receivables. Foreign
currency and interest rate swap agreements used among
different currencies, also serve to hedge foreign currency
exchange risk as well as interest rate risk.
The following tables provide information about Honda’s
fi nancial instruments that were sensitive to changes in interest
rates at March 31, 2008 and 2009. For fi nance receivables and
long-term debt, these tables present principal cash fl ows, fair
value and related weighted average interest rates. For interest
rate swaps and currency and interest rate swaps, the table
presents notional amounts, fair value and weighted average
interest rates. Variable interest rates are determined using
formulas such as LIBOR+ and an index.
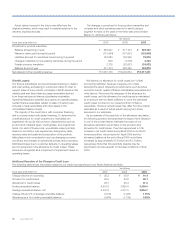
Quantitative and Qualitative Disclosure About Market
Risk
Honda is exposed to market risks, which are changes in foreign
currency exchanges rates, in interest rates and in prices of
marketable equity securities. Honda is a party to derivative
fi nancial instruments in the normal course of business in order
to manage risks associated with changes in foreign currency
exchange rates and in interest rates. Honda does not hold any
derivative fi nancial instruments for trading purposes.
Honda adopted Statement of Financial Accounting
Standards (SFAS) No. 157, “Fair Value Measurements” effective
April 1, 2008. This statement defi nes fair value as the price that
would be received to sell an asset or paid to transfer a liability
in an orderly transaction, and emphasizes that a fair value
measurement should be determined based on the assumptions
that market participants would use in pricing an asset or
liability. The adoption of this statement did not have a material
impact on the Company’s consolidated fi nancial position or
results of operations.
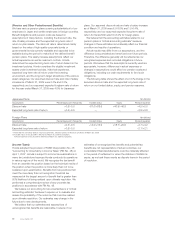
(Foreign Currency Exchange Rate Risk)
Foreign currency forward exchange contracts and purchased
option contracts are used to hedge currency risk of sale
commitments denominated in foreign currencies (principally
U.S. dollars).
Foreign currency written option contracts are entered into in
combination with purchased option contracts to offset
premium amounts to be paid for purchased option contracts.
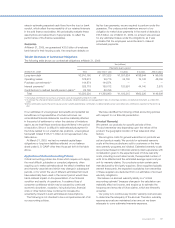
The tables below provide information about our derivatives
related to foreign currency exchange rate risk as of March 31,
2008 and 2009. For forward exchange contracts and currency
options, the table presents the contract amounts and fair value.
All forward exchange contracts and currency contracts to which
we are a party have original maturities of less than one year.
Foreign Exchange Risk
2008 2009
Yen (millions) Average
contractual
rate (Yen)
Yen (millions) Average
contractual
rate (Yen)Fiscal years ended March 31
Contract
amounts Fair value
Contract
amounts Fair value
Forward Exchange Contracts
To sell US$ ¥214,797 9,199 104.25 ¥182,941 (8,966) 93.33
To sell EUR 40,963 64 157.99 42,324 (2,086) 123.40
To sell CA$ 14,146 560 101.72 379 (5) 76.99
To sell GBP 70,227 2,739 207.07 49,681 (2,673) 133.42
To sell other foreign currencies 12,147 362 various 16,549 (387) various
To buy US$ 7,104 (196) 102.92 3,287 131 94.26
To buy other foreign currencies 2,272 (29) various 1,933 (11) various
Cross-currencies 254,189 (517) various 234,521 94 various
Total ¥615,845 12,182 ¥531,615 (13,903)
Currency Option Contracts
Option purchased to sell US$ ¥ 96,720 877 various ¥ 24,548 304 various
Option written to sell US$ 136,005 (502) various 51,551 (1,743) various
Option purchased to sell other currencies 17,378 409 various —— —
Option written to sell other currencies 22,101 (457) various — — —
Total ¥272,204 327 ¥ 76,099 (1,439)
Annual Report 2009 61