Honda 2009 Annual Report Download - page 66
Download and view the complete annual report
Please find page 66 of the 2009 Honda annual report below. You can navigate through the pages in the report by either clicking on the pages listed below, or by using the keyword search tool below to find specific information within the annual report.
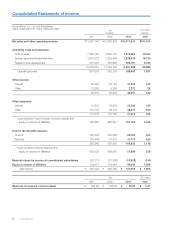
Consolidated Balance Sheets
Honda Motor Co., Ltd. and Subsidiaries
March 31, 2008 and 2009 Yen
(millions)
U.S. dollars
(millions)
Assets 2008 2009 2009
Current assets:
Cash and cash equivalents ¥ 1,050,902 ¥ 690,369 $ 7,028
Trade accounts and notes receivable, net of allowance
for doubtful accounts of ¥8,181 million in 2008 and
¥7,455 million ($76 million) in 2009 1,021,743 854,214 8,696
Finance subsidiaries—receivables, net 1,340,728 1,172,030 11,931
Inventories 1,199,260 1,243,961 12,664
Deferred income taxes 158,825 198,158 2,017
Other current assets 460,110 462,446 4,708
Total current assets 5,231,568 4,621,178 47,044
Finance subsidiaries—receivables, net 2,707,820 2,400,282 24,435
Investments and advances:
Investments in and advances to affi liates 549,812 505,835 5,149
Other, including marketable equity securities 222,110 133,234 1,357
Total investments and advances 771,922 639,069 6,506
Property on operating leases:
Vehicles 1,014,412 1,557,060 15,851
Less accumulated depreciation 95,440 269,261 2,741
Net property on operating leases 918,972 1,287,799 13,110
Property, plant and equipment, at cost:
Land 457,352 469,279 4,777
Buildings 1,396,934 1,446,090 14,721
Machinery and equipment 3,135,513 3,133,439 31,900
Construction in progress 227,479 159,567 1,624
5,217,278 5,208,375 53,022
Less accumulated depreciation and amortization 3,015,979 3,060,654 31,158
Net property, plant and equipment 2,201,299 2,147,721 21,864
Other assets 783,962 722,868 7,360
Total assets ¥12,615,543 ¥11,818,917 $120,319
Annual Report 2009
64


