Holiday Inn 2003 Annual Report Download - page 9
Download and view the complete annual report
Please find page 9 of the 2003 Holiday Inn annual report below. You can navigate through the pages in the report by either clicking on the pages listed below, or by using the keyword search tool below to find specific information within the annual report.-
 1
1 -
 2
2 -
 3
3 -
 4
4 -
 5
5 -
 6
6 -
 7
7 -
 8
8 -
 9
9 -
 10
10 -
 11
11 -
 12
12 -
 13
13 -
 14
14 -
 15
15 -
 16
16 -
 17
17 -
 18
18 -
 19
19 -
 20
20 -
21
-
22
-
23
-
24
-
25
-
26
-
27
-
28
-
29
-
30
-
31
-
32
-
33
-
34
-
35
-
36
-
37
-
38
-
39
-
40
-
41
-
42
-
43
-
44
-
45
-
46
-
47
-
48
-
49
-
50
-
51
-
52
-
53
-
54
-
55
-
56
-
57
-
58
-
59
-
60
-
61
-
62
-
63
-
64
-
65
-
66
-
67
-
68
 |
 |

The managed and franchised estate in EMEA opened 40 hotels
with over 6,500 rooms. Of these hotels, 78% were new build.
As at 31 December 2003, there were a further 96 hotels with
over 18,000 rooms signed and under development.
ASIA PACIFIC
Turnover in Asia Pacific for the 12 months ended 31 December
2003 was $185m, down $7m (4%) from the 12 months ended
31 December 2002.
In addition to the impact of the war in Iraq, trading in Asia
Pacific was depressed by the Bali bombing and the SARS
outbreak in Greater China.
Trading at the InterContinental Hong Kong fell sharply in
March 2003, but recovery commenced in the third and fourth
quarters. The opening of the award-winning Spoon restaurant
in the InterContinental Hong Kong in October lifted non-rooms
revenue. In Australia, the Rugby World Cup gave trading a
boost in the second half of the year.
Initiatives to increase revenue within the region included the
roll-out of local websites for China, Australia and New Zealand,
and the opening of a Central Reservations Office based in
Guangzhou, The People’s Republic Of China, supporting calls
in Cantonese and Mandarin. The addition during the year of Air
China as a Priority Club Rewards partner further strengthened
our travel alliances in the region.
System growth continued in the region with a net increase of
over 3,000 rooms operated under management agreements.
Highlights of the new openings were five InterContinental
hotels in Thailand, Australia and India, and four Holiday Inns
in Greater China. The new Holiday Inns in China brought
the system size to 44 hotels, which together with the
18 management agreements signed, but under development,
extended IHG’s leadership in the key Greater China market.
The region continues to explore innovative deal structures, and
was awarded the ‘Deal of the Year’ award at the 2003 Asia
Pacific Hotel Investment conference for securing the
management of the new InterContinental Bangkok and a
neighbouring hotel, to open as a Holiday Inn in 2005.
CENTRAL
Central overheads principally comprise the costs of global
functions that were centralised following the reorganisation
review, reduced by holidex fee income. The reduction in gross
central costs from £121m for the year ended 31 December
2002, to £106m for 2003, primarily reflects savings driven from
the reorganisation review.
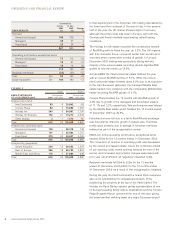
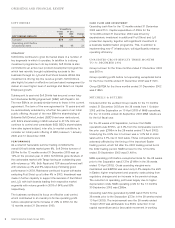
FIGURE 4
Hotels Rooms
ASIA PACIFIC SYSTEM SIZE Change Change
AT 31 DECEMBER 2003 2003 over 2002 2003 over 2002
Analysed by brand:
InterContinental 26 49,130 49
Crowne Plaza 34 311,558 657
Holiday Inn 80 –19,383 1,158
Holiday Inn Express 2-1 232 -52
Other brands 10 -3 1,702 -432
Total 152 342,005 1,380
Analysed by ownership type:
Owned and leased 14 -2 3,271 -318
Managed 100 10 30,246 3,165
Franchised 38 -5 8,488 -1,467
Total 152 342,005 1,380
Analysed by geography:
Australia, New Zealand,
South Pacific 49 210,296 978
Greater China 44 416,263 1,646
Rest of Asia Pacific 59 -3 15,446 -1,244
Total 152 342,005 1,380
12 months to
31 Dec 31 Dec
2003 2002 Change
ASIA PACIFIC RESULTS $m $m %
Tu r n ov er :
Owned and leased 154 156 -1
Managed 26 30 -13
Franchised 56 -17
185 192 -4
Operating profit before exceptional items:
Owned and leased 18 27 -33
Managed 15 24 -38
Franchised 45 -20
37 56 -34
Regional overheads (18) (17) 6
Total $m 19 39 -51
Sterling equivalent £m 12 26 -54
12 months to
31 Dec 31 Dec
2003 2002 Change
CENTRAL £m £m %
Tur nover 41 41 –
Gross central costs (106) (121) -12
Net central costs £m (65) (80) -19
Dollar equivalent $m (105) (121) -13
7