Holiday Inn 2003 Annual Report Download - page 49
Download and view the complete annual report
Please find page 49 of the 2003 Holiday Inn annual report below. You can navigate through the pages in the report by either clicking on the pages listed below, or by using the keyword search tool below to find specific information within the annual report.-
 1
1 -
2
-
3
-
4
-
5
-
6
-
7
-
8
-
9
-
10
-
11
-
12
-
13
-
14
-
15
-
16
-
17
-
18
-
19
-
20
-
21
-
22
-
23
-
24
-
25
-
26
-
27
-
28
-
29
-
30
-
31
-
32
-
33
-
34
-
35
-
36
-
37
-
38
-
 39
39 -
 40
40 -
 41
41 -
 42
42 -
 43
43 -
 44
44 -
 45
45 -
 46
46 -
 47
47 -
 48
48 -
 49
49 -
 50
50 -
 51
51 -
 52
52 -
 53
53 -
 54
54 -
 55
55 -
 56
56 -
 57
57 -
 58
58 -
 59
59 -
60
-
61
-
62
-
63
-
64
-
65
-
66
-
67
-
68
 |
 |

47
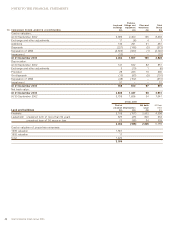
Group Company
restated*
Investments Shares in Loans to
and Group Group
advances undertakings undertakings Total
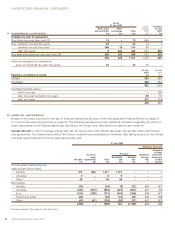
20 FIXED ASSET INVESTMENTS £m £m £m £m
Cost:
At 30 September 2002 339–––
Exchange adjustments (34) – – –
Reclassification 6–––
Additions 42 741 420 1,161
Disposals and repayments (12) – – –
At 31 December 2003 341 741 420 1,161
Provision for diminution in value:
At 30 September 2002 121–––
Exchange adjustments (20) – – –
Reclassification 3–––
Provisions made** 65–––
At 31 December 2003 169–––
Net book value:
At 31 December 2003 172 741 420 1,161
At 30 September 2002 218–––
* Restated on the adoption of UITF 38 (see page 32).
** Relates to a provision for diminution in value of the Group’s investment in FelCor Lodging Trust Inc. and other fixed asset investments.
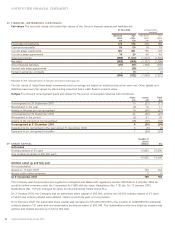
31 Dec 2003 30 Sept 2002
restated*
Cost less Cost less
amount Market amount Market
written off value written off value
Investments and advances £m £m £m £m
Group
Listed investments 64 66 116 87
Unlisted investments 108 102
172 218
All listed investments are listed on a recognised investment exchange.
* Restated on the adoption of UITF 38 (see page 32).
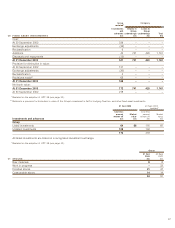
Group
31 Dec 30 Sept
2003 2002
21 STOCKS £m £m
Raw materials 98
Work in progress –22
Finished stocks 21 47
Consumable stores 14 14
44 91