Holiday Inn 2003 Annual Report Download - page 52
Download and view the complete annual report
Please find page 52 of the 2003 Holiday Inn annual report below. You can navigate through the pages in the report by either clicking on the pages listed below, or by using the keyword search tool below to find specific information within the annual report.-
 1
1 -
2
-
3
-
4
-
5
-
6
-
7
-
8
-
9
-
10
-
11
-
12
-
13
-
14
-
15
-
16
-
17
-
18
-
19
-
20
-
21
-
22
-
23
-
24
-
25
-
26
-
27
-
28
-
29
-
30
-
31
-
32
-
33
-
34
-
35
-
36
-
37
-
38
-
39
-
40
-
41
-
 42
42 -
 43
43 -
 44
44 -
 45
45 -
 46
46 -
 47
47 -
 48
48 -
 49
49 -
 50
50 -
 51
51 -
 52
52 -
 53
53 -
 54
54 -
 55
55 -
 56
56 -
 57
57 -
 58
58 -
 59
59 -
 60
60 -
 61
61 -
 62
62 -
63
-
64
-
65
-
66
-
67
-
68
 |
 |

50 InterContinental Hotels Group 2003
NOTES TO THE FINANCIAL STATEMENTS
Group
31 Dec 2003 Group Company
Bank loans Other 30 Sept 31 Dec
and overdrafts borrowings Total 2002 2003
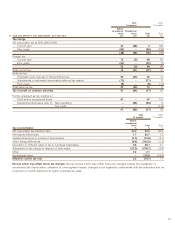
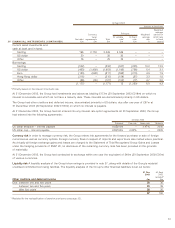
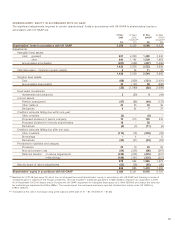
27 BORROWINGS (CONTINUED) £m £m £m £m £m
Analysis by year of repayment
Due within one year (see note 23) 13 – 13 848 –
Due: between one and two years 42 – 42 14 –
between two and five years 496 18 514 84 –
after five years 8 424 432 533 420
Due after more than one year (see note 24) 546 442 988 631 420
559 442 1,001 1,479 420
Amounts repayable by instalments,
some of which fall due after five years 22 – 22 23 –
31 Dec 30 Sept
2003 2002
Facilities committed by banks £m £m
Utilised 554 684
Unutilised 408 944
962 1,628
Unutilised facilities expire:
within one year –590
after one year but before two years 36 30
after two years 372 324
408 944
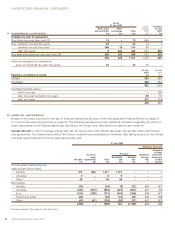
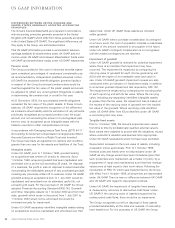
28 FINANCIAL INSTRUMENTS
Details of the Group’s policies on the use of financial instruments are given in the Operating and Financial Review on pages 9
to 11 and in the accounting policies on page 33. The following disclosures provide additional information regarding the effect of
these instruments on the financial assets and liabilities of the Group, other than short-term debtors and creditors.
Interest rate risk In order to manage interest rate risk, the Group enters into interest rate swap, interest rate option and forward
rate agreements. The interest rate profile of the Group’s material financial assets and liabilities, after taking account of the interest
rate swap agreements and currency swap agreements, was:
31 Dec 2003
Interest at fixed rate
Weighted
average
Currency Principal Weighted period for
swap At variable At fixed average which rate
Net debt agreements Total rate* rate rate is fixed
£m £m £m £m £m % (years)
Current asset investments and
cash at bank and in hand:
Sterling 377 934 1,311 1,311–––
US dollar 9–99–––
Other 46–4646–––
Borrowings:
Sterling (24) – (24) (3) (21) 5.0 4.1
US dollar (337) (615) (952) (301) (651) 4.7 1.5
Euro (514) (258) (772) (403) (369) 4.8 4.7
Hong Kong dollar (84) – (84) (57) (27) 5.2 0.8
Other (42) (61) (103) (82) (21) 4.7 0.7
(569) – (569) 520 (1,089) 4.8 2.6
* Primarily based on the relevant inter-bank rate.