Holiday Inn 2003 Annual Report Download - page 7
Download and view the complete annual report
Please find page 7 of the 2003 Holiday Inn annual report below. You can navigate through the pages in the report by either clicking on the pages listed below, or by using the keyword search tool below to find specific information within the annual report.-
 1
1 -
 2
2 -
 3
3 -
 4
4 -
 5
5 -
 6
6 -
 7
7 -
 8
8 -
 9
9 -
 10
10 -
 11
11 -
 12
12 -
 13
13 -
 14
14 -
 15
15 -
 16
16 -
 17
17 -
 18
18 -
19
-
20
-
21
-
22
-
23
-
24
-
25
-
26
-
27
-
28
-
29
-
30
-
31
-
32
-
33
-
34
-
35
-
36
-
37
-
38
-
39
-
40
-
41
-
42
-
43
-
44
-
45
-
46
-
47
-
48
-
49
-
50
-
51
-
52
-
53
-
54
-
55
-
56
-
57
-
58
-
59
-
60
-
61
-
62
-
63
-
64
-
65
-
66
-
67
-
68
 |
 |

AMERICAS
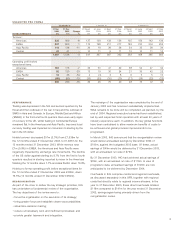
Revenue per available room (‘RevPAR’) performance in the
franchised estate finished the 12 months ended 31 December
2003 0.3% down from the prior year at $46.61. The war in Iraq
in the first half of the year caused franchised RevPAR to fall
2.6%. In the third and fourth quarters, the franchised estate
recorded 1.5% and 2.7% RevPAR growth respectively. All brands
recorded a stronger second half to the year, with InterContinental,
Express and Staybridge Suite franchises all recording over
3.5% year-on-year growth for the second six months.
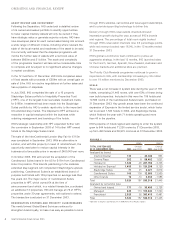
RevPAR growth in the owned and managed estates followed
a similar trend with the second half of the year significantly
up on the first. The InterContinental owned estate, with its major
gateway city exposure, grew year-on-year in each quarter as
stability returned to the travel market. The InterContinental
hotels in Chicago, New York, San Francisco and Miami all
recorded strong growth in the second half of 2003.
Managed results include the full profit and loss account for
certain properties where IHG is responsible for the underlying
operations. Pro forma operating profit before exceptional items
in the managed estate fell due to RevPAR declines in the
managed InterContinental and Crowne Plaza estates in North
and Latin America and the agreed payments made to HPT
under our management contract.
In July 2003, IHG sold 16 Staybridge Suites to HPT for $185m,
retaining management and branding. Subsequently, HPT has
converted 14 other suite hotels to IHG’s Staybridge Suite brand
and management.
Total Americas overheads including direct costs, were down
10%, with the separately disclosed regional overheads down
3%. The region finished with pro forma operating profit before
exceptional items for the 12 months ended 31 December 2003
of $262m, marginally ahead of 2002 ($260m for the 12 months
ended 31 December 2002).
The weakening of the US dollar against sterling had a negative
impact in the second half of the year and the Americas
finished the 12 months ended 31 December 2003 with pro
forma operating profit before exceptional items in sterling of
£161m, down 7% from the 12 months ended 31 December 2002.
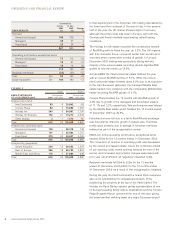
EMEA
Turnover in EMEA totalled £807m for the 12 months ended
31 December 2003, an increase of £7m on 2002. Owned and
leased turnover grew by £7m with the reopening during the
year of the refurbished InterContinental Le Grand Paris and
the opening of the newly built Crowne Plaza Brussels Airport,
Holiday Inn Paris Disney and three Express hotels in Germany.
RevPAR in the region finished the 12 months ended
31 December 2003 down 0.7% on the prior 12 months at
$56.36. The trend in the first half of the year was similar
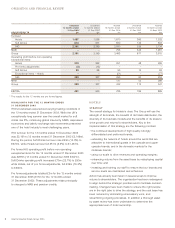
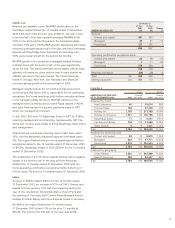
FIGURE 2
Hotels Rooms
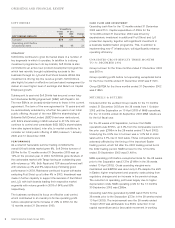
AMERICAS SYSTEM SIZE Change Change
AT 31 DECEMBER 2003 2003 over 2002 2003 over 2002
Analysed by brand:
InterContinental 46 215,074 866
Crowne Plaza 106 –31,235 -336
Holiday Inn 1,109 -32 213,389 -6,094
Holiday Inn Express 1,321 65 106,796 6,635
Staybridge Suites 71 21 8,221 2,619
Candlewood Suites 109 109 12,569 12,569
Other brands 6-6 1,221 -1,074
Total 2,768 159 388,505 15,185
Analysed by ownership type:
Owned and leased 28 -16 9,870 -1,956
Managed 222 101 47,711 12,218
Franchised 2,518 74 330,924 4,923
Total 2,768 159 388,505 15,185
Analysed by geography:
United States 2,530 151 345,968 14,324
Rest of Americas 238 842,537 861
Total 2,768 159 388,505 15,185
5
12 months to
31 Dec 31 Dec
2003 2002 Change
AMERICAS RESULTS $m $m %
Tu r n ov er :
Owned and leased 481 481 –
Managed 46 51 -10
Franchised 327 325 1
854 857 –
Operating profit before exceptional items:
Owned and leased 32 38 -16
Managed 711 -36
Franchised 279 269 4
318 318 –
Regional overheads (56) (58) -3
Total $m 262 260 1
Sterling equivalent £m 161 173 -7