Holiday Inn 2003 Annual Report Download - page 44
Download and view the complete annual report
Please find page 44 of the 2003 Holiday Inn annual report below. You can navigate through the pages in the report by either clicking on the pages listed below, or by using the keyword search tool below to find specific information within the annual report.-
 1
1 -
2
-
3
-
4
-
5
-
6
-
7
-
8
-
9
-
10
-
11
-
12
-
13
-
14
-
15
-
16
-
17
-
18
-
19
-
20
-
21
-
22
-
23
-
24
-
25
-
26
-
27
-
28
-
29
-
30
-
31
-
32
-
33
-
 34
34 -
 35
35 -
 36
36 -
 37
37 -
 38
38 -
 39
39 -
 40
40 -
 41
41 -
 42
42 -
 43
43 -
 44
44 -
 45
45 -
 46
46 -
 47
47 -
 48
48 -
 49
49 -
 50
50 -
 51
51 -
 52
52 -
 53
53 -
 54
54 -
55
-
56
-
57
-
58
-
59
-
60
-
61
-
62
-
63
-
64
-
65
-
66
-
67
-
68
 |
 |

42 InterContinental Hotels Group 2003
NOTES TO THE FINANCIAL STATEMENTS
2003 2002 2003 2002
15 months 12 months 15 months 12 months
restated*
pence pence
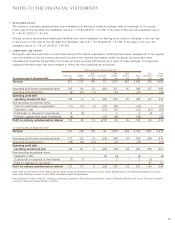
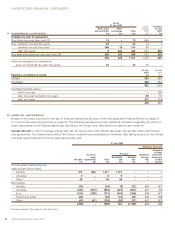
10 DIVIDENDS per share per share £m £m
Dividends on ordinary shares:
Interim Six Continents PLC 7.65 12.58 56 92
Proposed final Six Continents PLC –29.14 –213
Interim InterContinental Hotels Group PLC 4.05 –30 –
Proposed final InterContinental Hotels Group PLC 9.45 –70 –
21.15 41.72 156 305
The proposed final dividend is payable on the shares in issue at 26 March 2004.
* Restated based on an equivalent number of shares of InterContinental Hotels Group PLC.
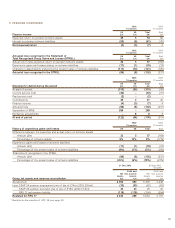
11 EARNINGS PER ORDINARY SHARE
Basic earnings per ordinary share is calculated by dividing the earnings available for shareholders of £19m (2002 £457m) by
733m (2002 731m), being the weighted average number of ordinary shares, excluding investment in own shares, in issue during
the period. The weighted average number of shares in issue has been based on the aggregate of the weighted average number
of shares of InterContinental Hotels Group PLC and Six Continents PLC adjusted to equivalent shares of InterContinental Hotels
Group PLC. The comparatives have been restated accordingly.
Diluted earnings per ordinary share is calculated by adjusting basic earnings per ordinary share to reflect the notional exercise
of the weighted average number of dilutive ordinary share options outstanding during the period. The resulting weighted average
number of ordinary shares is 733m (2002 734m).
Adjusted earnings per ordinary share is calculated as follows:
2003 2002
15 months 12 months
restated*
pence pence
per ordinary per ordinary
note share share
Basic earnings 2.6 62.5
Exceptional items, less tax thereon 7, 9 45.8 (11.1)
Adjusted earnings 48.4 51.4
Adjusted earnings per ordinary share is disclosed in order to show performance undistorted by exceptional items.
* Restated to exclude all exceptional items for comparability with 2003 disclosures.
2003 2002
15 months 12 months
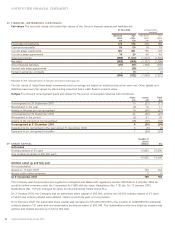
12 CASH FLOW FROM OPERATING ACTIVITIES note £m £m
Operating profit before exceptional items 483 618
Depreciation and amortisation 303 271
Earnings before interest, taxation, depreciation and amortisation and exceptional items 786 889
Other non-cash items (2) (4)
Increase in stocks (1) (1)
Increase in debtors (10) (92)
Increase/(decrease) in creditors 69 (37)
Provisions expended 26 (10) (18)
Operating activities before expenditure relating to exceptional items 832 737
Cost of fundamental reorganisation 26 (37) –
Operating exceptional expenditure –(17)
Operating activities 795 720
Net capital expenditure 14 (248) (513)
Operating cash flow 15 547 207