Holiday Inn 2003 Annual Report Download - page 40
Download and view the complete annual report
Please find page 40 of the 2003 Holiday Inn annual report below. You can navigate through the pages in the report by either clicking on the pages listed below, or by using the keyword search tool below to find specific information within the annual report.-
 1
1 -
2
-
3
-
4
-
5
-
6
-
7
-
8
-
9
-
10
-
11
-
12
-
13
-
14
-
15
-
16
-
17
-
18
-
19
-
20
-
21
-
22
-
23
-
24
-
25
-
26
-
27
-
28
-
29
-
 30
30 -
 31
31 -
 32
32 -
 33
33 -
 34
34 -
 35
35 -
 36
36 -
 37
37 -
 38
38 -
 39
39 -
 40
40 -
 41
41 -
 42
42 -
 43
43 -
 44
44 -
 45
45 -
 46
46 -
 47
47 -
 48
48 -
 49
49 -
 50
50 -
51
-
52
-
53
-
54
-
55
-
56
-
57
-
58
-
59
-
60
-
61
-
62
-
63
-
64
-
65
-
66
-
67
-
68
 |
 |

38 InterContinental Hotels Group 2003
NOTES TO THE FINANCIAL STATEMENTS
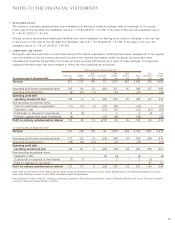
5 PENSIONS (CONTINUED)
FRS 17 disclosures The valuations used for FRS 17 disclosures are based on the results of the actuarial valuations at
31 March 2002 updated by independent qualified actuaries to 31 December 2003. Scheme assets are stated at market value at
31 December 2003 and the liabilities of the schemes have been assessed as at the same date using the projected unit method.
As the principal plans are now closed as defined benefit schemes, the current service cost as calculated under the projected
unit method will increase as members approach retirement.
The principal assumptions used by the actuaries to determine the liabilities on an FRS 17 basis were:
31 Dec 2003 30 Sept 2002 30 Sept 2001
UK US UK US UK US
%%%%%%
Wages and salaries increases 4.3 – 3.8 – 3.9 –
Pensions increases 2.8 – 2.3 – 2.4 –
Discount rate 5.4 6.3 5.5 6.8 6.1 7.5
Inflation rate 2.8 – 2.3 – 2.4 –
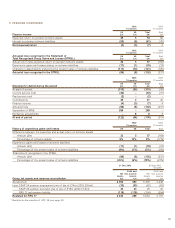
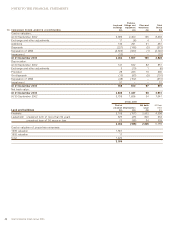
The combined assets of the principal schemes and expected rate of return were:
31 Dec 2003 30 Sept 2002 30 Sept 2001
Long-term Long-term Long-term
rate of rate of rate of
return return return
expected Value expected Value expected Value
UK Schemes %£m %£m %£m
Equities 8.0 238 8.0 507 7.5 700
Bonds 5.4 117 4.7 397 5.1 304
Other ––8.0 92 7.5 94
Total market value of assets 355 996 1,098
31 Dec 2003 30 Sept 2002 30 Sept 2001
Long-term Long-term Long-term
rate of rate of rate of
return return return
expected Value expected Value expected Value
US Schemes %£m %£m %£m
Equities 9.2 29 11.2 27 11.5 29
Bonds 6.0 19 6.2 22 7.0 25
Total market value of assets 48 49 54
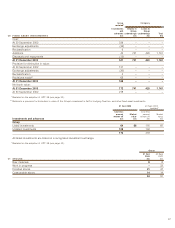
30 Sept 30 Sept
31 Dec 2003 2002 2001
UK US Total Total Total
£m £m £m £m £m
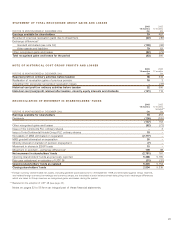
Total market value of assets 355 48 403 1,045 1,152
Present value of scheme liabilities (477) (102) (579) (1,415) (1,207)
Deficit in the scheme (122) (54) (176) (370) (55)
Related deferred tax asset 37 21 58 116 21
Net pension liability (85) (33) (118) (254) (34)
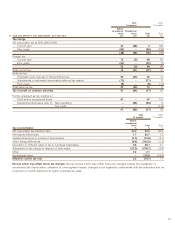
If FRS 17 had been recognised in the financial statements, the effects would have been as follows:
2003 2002
15 months 12 months
UK US Total Total
Operating profit charge £m £m £m £m
Current service cost 32 – 32 31
Past service cost 2–2–
Total operating profit charge 34 – 34 31