Holiday Inn 2003 Annual Report Download - page 15
Download and view the complete annual report
Please find page 15 of the 2003 Holiday Inn annual report below. You can navigate through the pages in the report by either clicking on the pages listed below, or by using the keyword search tool below to find specific information within the annual report.-
 1
1 -
2
-
3
-
4
-
 5
5 -
 6
6 -
 7
7 -
 8
8 -
 9
9 -
 10
10 -
 11
11 -
 12
12 -
 13
13 -
 14
14 -
 15
15 -
 16
16 -
 17
17 -
 18
18 -
 19
19 -
 20
20 -
 21
21 -
 22
22 -
 23
23 -
 24
24 -
 25
25 -
26
-
27
-
28
-
29
-
30
-
31
-
32
-
33
-
34
-
35
-
36
-
37
-
38
-
39
-
40
-
41
-
42
-
43
-
44
-
45
-
46
-
47
-
48
-
49
-
50
-
51
-
52
-
53
-
54
-
55
-
56
-
57
-
58
-
59
-
60
-
61
-
62
-
63
-
64
-
65
-
66
-
67
-
68
 |
 |

13
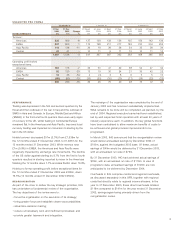
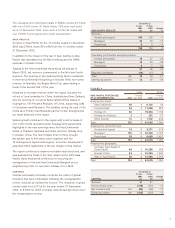
UNAUDITED PRO FORMA PROFIT AND LOSS ACCOUNT
12 months to 12 months to
31 Dec 2003 31 Dec 2002
INTERCONTINENTALS HOTELS GROUP £m £m
Tu r n ov er :
Americas 525 569
EMEA 807 800
Asia Pacific 114 128
Central 41 41
Total Hotels 1,487 1,538
Soft Drinks 674 611
Total turnover 2,161 2,149
Operating profit:
Americas 161 173
EMEA 92 120
Asia Pacific 12 26
Central (65) (80)
Total Hotels 200 239
Soft Drinks 83 68
Total operating profit 283 307
Net interest charge (39) (49)
Profit before taxation 244 258
Tax charge (61) (71)
Minority equity interests (30) (26)
Retained profit for the period 153 161
EBITDA 481 500
Earnings per share (pence) 20.8 21.9
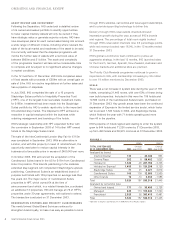
UNAUDITED PRO FORMA OPERATING ASSETS STATEMENT
31 Dec 31 Dec
2003 2002
INTERCONTINENTAL HOTELS GROUP £m £m
Intangible assets 158 157
Tangible assets 3,951 4,138
Investments 172 215
Fixed assets 4,281 4,510
Stocks 44 43
Debtors 486 456
Creditors – amounts falling due
within one year (597) (521)
Creditors – amounts falling due
after one year (97) (143)
Provisions for liabilities and charges (79) (17)
Net operating assets 4,038 4,328
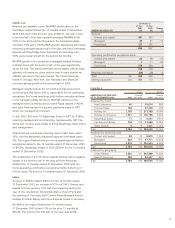
UNAUDITED PRO FORMA OPERATING CASH FLOW
12 months to
Dec 2003
INTERCONTINENTAL HOTELS GROUP £m
Operating profit 283
Depreciation and amortisation 198
EBITDA 481
Stocks (2)
Debtors (19)
Creditors 61
Provisions and other non-cash items (10)
Operating activities 511
Capital expenditure (354)
Disposal proceeds 254
Operating cash flow 411