Holiday Inn 2003 Annual Report Download - page 38
Download and view the complete annual report
Please find page 38 of the 2003 Holiday Inn annual report below. You can navigate through the pages in the report by either clicking on the pages listed below, or by using the keyword search tool below to find specific information within the annual report.-
 1
1 -
2
-
3
-
4
-
5
-
6
-
7
-
8
-
9
-
10
-
11
-
12
-
13
-
14
-
15
-
16
-
17
-
18
-
19
-
20
-
21
-
22
-
23
-
24
-
25
-
26
-
27
-
 28
28 -
 29
29 -
 30
30 -
 31
31 -
 32
32 -
 33
33 -
 34
34 -
 35
35 -
 36
36 -
 37
37 -
 38
38 -
 39
39 -
 40
40 -
 41
41 -
 42
42 -
 43
43 -
 44
44 -
 45
45 -
 46
46 -
 47
47 -
 48
48 -
49
-
50
-
51
-
52
-
53
-
54
-
55
-
56
-
57
-
58
-
59
-
60
-
61
-
62
-
63
-
64
-
65
-
66
-
67
-
68
 |
 |

36 InterContinental Hotels Group 2003
NOTES TO THE FINANCIAL STATEMENTS
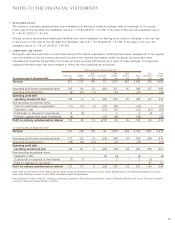
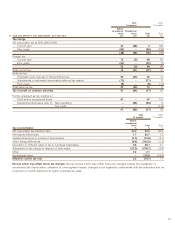
2 TURNOVER AND PROFIT (CONTINUED) Profit on
ordinary
Tu r no ve r activities
By By before
origin destination interest
15 months ended 31 December 2003* £m £m £m
United Kingdom 2,131 2,124 117
Rest of Europe, the Middle East and Africa 506 513 (7)
United States of America 571 571 63
Rest of Americas 127 127 28
Asia Pacific 148 148 18
3,483 3,483 219
12 months ended 30 September 2002*
United Kingdom 2,491 2,485 436
Rest of Europe, the Middle East and Africa 411 416 57
United States of America 476 476 78
Rest of Americas 108 108 16
Asia Pacific 129 130 7
3,615 3,615 594
* Other than for Soft Drinks which reflects the 64 weeks ended 20 December (2002 52 weeks ended 28 September) and Mitchells & Butlers plc which
reflects the 28 weeks ended 12 April (2002 52 weeks ended 28 September).
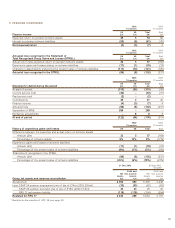
2003 2002
15 months 12 months
Continuing Discontinued Continuing Discontinued
operations operations* Total operations operations* Total
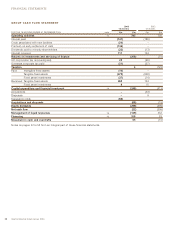
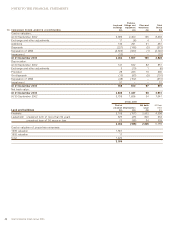
3 COSTS AND OVERHEADS, LESS OTHER INCOME £m £m £m £m £m £m
Raw materials and consumables 484 204 688 360 377 737
Changes in stocks of finished goods and work in progress (1) 2 1 3 (5) (2)
Staff costs (see note 4) 815 198 1,013 659 378 1,037
Depreciation of tangible fixed assets 236 54 290 175 86 261
Impairment of tangible fixed assets 51 – 51 77 – 77
Amortisation of goodwill 13 – 13 9110
Hire of plant and machinery 18 17 35 19 30 49
Property rentals 65 24 89 58 42 100
Income from fixed asset investments (3) – (3) (8) – (8)
Other external charges 717 157 874 530 283 813
2,395 656 3,051 1,882 1,192 3,074
Operating exceptional items included above:
Impairment of tangible fixed assets 51 – 51 77 – 77
* Relates to Mitchells & Butlers plc.
2003 2002
15 months 12 months
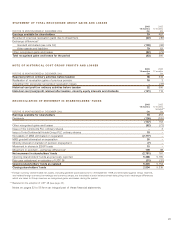
Auditors’ remuneration paid to Ernst & Young LLP £m £m
Audit fees 2.8 1.9
Audit related fees 7.2 3.2
Tax fees 1.2 1.2
Other fees –0.4
11.2 6.7
Audit related fees include £6.3m (2002 £1.7m) in relation to the Separation and bid defence. These costs have been charged to
exceptional items (see note 7). Non-audit fees payable for UK services were £6.6m (2002 £4.1m).
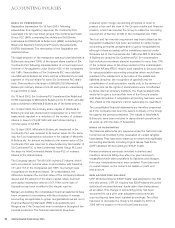
The Audit Committee has introduced a process to ensure that any non-audit services do not compromise the independence and
objectivity of the external auditor, and that relevant UK and US professional and regulatory requirements are met. A number of
criteria are applied when deciding whether pre-approval for such services should be given. These include the nature of the
service, the level of fees, and the practicality of appointing an alternative provider, having regard to the skills and experience
required to supply the service effectively. Cumulative fees for audit and non-audit services are presented to the Audit Committee
on a quarterly basis for review. The Audit Committee is responsible for monitoring adherence to the pre-approval policy.