Holiday Inn 2003 Annual Report Download - page 37
Download and view the complete annual report
Please find page 37 of the 2003 Holiday Inn annual report below. You can navigate through the pages in the report by either clicking on the pages listed below, or by using the keyword search tool below to find specific information within the annual report.-
 1
1 -
2
-
3
-
4
-
5
-
6
-
7
-
8
-
9
-
10
-
11
-
12
-
13
-
14
-
15
-
16
-
17
-
18
-
19
-
20
-
21
-
22
-
23
-
24
-
25
-
26
-
 27
27 -
 28
28 -
 29
29 -
 30
30 -
 31
31 -
 32
32 -
 33
33 -
 34
34 -
 35
35 -
 36
36 -
 37
37 -
 38
38 -
 39
39 -
 40
40 -
 41
41 -
 42
42 -
 43
43 -
 44
44 -
 45
45 -
 46
46 -
 47
47 -
48
-
49
-
50
-
51
-
52
-
53
-
54
-
55
-
56
-
57
-
58
-
59
-
60
-
61
-
62
-
63
-
64
-
65
-
66
-
67
-
68
 |
 |

35
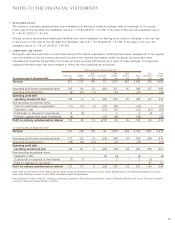
NOTES TO THE FINANCIAL STATEMENTS
1 EXCHANGE RATES
The results of overseas operations have been translated into sterling at weighted average rates of exchange for the period.
In the case of the US dollar, the translation rate is £1 = $1.62 (2002 £1 = $1.48). In the case of the euro, the translation rate is
£1 = €1.47 (2002 £1 = €1.60).
Foreign currency denominated assets and liabilities have been translated into sterling at the rates of exchange on the last day
of the period. In the case of the US dollar, the translation rate is £1 = $1.78 (2002 £1 = $1.56). In the case of the euro, the
translation rate is £1 = €1.41 (2002 £1 = €1.59).
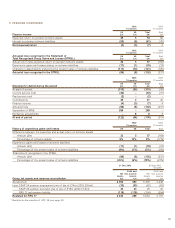
2 TURNOVER AND PROFIT
During the year, IHG undertook a fundamental review of the Hotels organisation. Following this review, management in the regions
now concentrate on the key revenue and profit drivers of the regional businesses, whilst key global functions have been
centralised to maximise the benefits of our scale and drive process efficiencies. As a result of these changes, the segmental
analysis presented below has been restated to reflect the new organisational structures.
InterContinental Hotels Group PLC**
Asia Total Soft Dis- Total
Americas EMEA Pacific Corporate Hotels Drinks Total continued** Group
15 months ended 31 December 2003* £m £m £m £m £m £m £m £m £m
Tu r nove r 661 1,010 148 51 1,870 820 2,690 793 3,483
Operating profit before exceptional items 195 114 22 (80) 251 95 346 137 483
Operating exceptional item (9) (41) (1) – (51) – (51) – (51)
Operating profit after
operating exceptional item 186 73 21 (80) 200 95 295 137 432
Non-operating exceptional items:
Cost of fundamental reorganisation (11) (17) (2) (37) (67) – (67) – (67)
Separation costs – – – (51) (51) – (51) (41) (92)
Profit/(loss) on disposal of fixed assets 10 (6) – – 4 – 4 (2) 2
Provision against fixed asset investments (9) – – (47) (56) – (56) – (56)
Profit on ordinary activities before interest 176 50 19 (215) 30 95 125 94 219
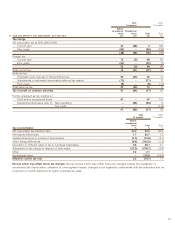
12 months ended 30 September 2002*
Tu r nove r 570 794 128 40 1,532 602 2,134 1,481 3,615
Operating profit before exceptional items 173 125 23 (55) 266 63 329 289 618
Operating exceptional item (39) (24) (14) – (77) – (77) – (77)
Operating profit after
operating exceptional item 134 101 9 (55) 189 63 252 289 541
Non-operating exceptional items:
Separation costs – – – (4) (4) – (4) – (4)
(Loss)/profit on disposal of fixed assets (7) 9 – – 2 – 2 (2) –
Profit on disposal of operations –––––––5757
Profit on ordinary activities before interest 127 110 9 (59) 187 63 250 344 594
* Other than for Soft Drinks which reflects the 64 weeks ended 20 December (2002 52 weeks ended 28 September) and Mitchells & Butlers plc which
reflects the 28 weeks ended 12 April (2002 52 weeks ended 28 September).
** InterContinental Hotels Group PLC relates to continuing operations. Discontinued operations relate to Mitchells & Butlers plc and in 2002 also included
a profit on disposal of Bass Brewers of £57m.