Holiday Inn 2003 Annual Report Download - page 64
Download and view the complete annual report
Please find page 64 of the 2003 Holiday Inn annual report below. You can navigate through the pages in the report by either clicking on the pages listed below, or by using the keyword search tool below to find specific information within the annual report.-
 1
1 -
2
-
3
-
4
-
5
-
6
-
7
-
8
-
9
-
10
-
11
-
12
-
13
-
14
-
15
-
16
-
17
-
18
-
19
-
20
-
21
-
22
-
23
-
24
-
25
-
26
-
27
-
28
-
29
-
30
-
31
-
32
-
33
-
34
-
35
-
36
-
37
-
38
-
39
-
40
-
41
-
42
-
43
-
44
-
45
-
46
-
47
-
48
-
49
-
50
-
51
-
52
-
53
-
 54
54 -
 55
55 -
 56
56 -
 57
57 -
 58
58 -
 59
59 -
 60
60 -
 61
61 -
 62
62 -
 63
63 -
 64
64 -
 65
65 -
 66
66 -
 67
67 -
 68
68
 |
 |

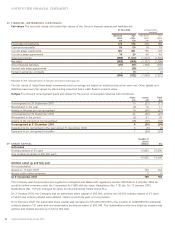
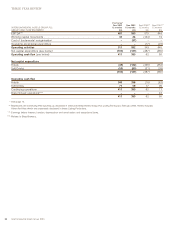
62 InterContinental Hotels Group 2003
Pro forma*
Dec 2003 Dec 2003 Sept 2002** Sept 2001**
INTERCONTINENTAL HOTELS GROUP PLC 12 months 15 months 12 months 12 months
GROUP CASH FLOW STATEMENT £m £m £m £m
EBITDA*** 481 595 510 644
Working capital movements 30 24 (144) 19
Cost of fundamental reorganisation – (37) ––
Operating exceptional expenditure ––(17) (23)
Operating activities 511 582 349 640
Net capital expenditure (see below) (100) (187) (287) (580)
Operating cash flow (see below) 411 395 62 60
Net capital expenditure
Hotels (45) (122) (256) (552)
Soft Drinks (55) (65) (31) (28)
(100) (187) (287) (580)
Operating cash flow
Hotels 340 336 (15) (82)
Soft Drinks 71 59 77 99
Continuing operations 411 395 62 17
Discontinued operations**** –––43
411 395 62 60
* See page 12.
** Represents the continuing IHG business as disclosed in InterContinental Hotels Group PLC Listing Particulars February 2003. Hotels includes
Other Activities which was separately disclosed in those Listing Particulars.
*** Earnings before interest, taxation, depreciation and amortisation and exceptional items.
**** Relates to Bass Brewers.
THREE YEAR REVIEW