Holiday Inn 2003 Annual Report Download - page 5
Download and view the complete annual report
Please find page 5 of the 2003 Holiday Inn annual report below. You can navigate through the pages in the report by either clicking on the pages listed below, or by using the keyword search tool below to find specific information within the annual report.-
 1
1 -
 2
2 -
 3
3 -
 4
4 -
 5
5 -
 6
6 -
 7
7 -
 8
8 -
 9
9 -
 10
10 -
 11
11 -
 12
12 -
 13
13 -
 14
14 -
 15
15 -
 16
16 -
17
-
18
-
19
-
20
-
21
-
22
-
23
-
24
-
25
-
26
-
27
-
28
-
29
-
30
-
31
-
32
-
33
-
34
-
35
-
36
-
37
-
38
-
39
-
40
-
41
-
42
-
43
-
44
-
45
-
46
-
47
-
48
-
49
-
50
-
51
-
52
-
53
-
54
-
55
-
56
-
57
-
58
-
59
-
60
-
61
-
62
-
63
-
64
-
65
-
66
-
67
-
68
 |
 |

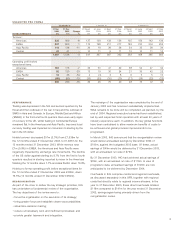
PERFORMANCE
Trading was depressed in the first and second quarters by the
threat and then outbreak of the war in Iraq and the outbreak of
SARS in Asia and Canada. In Europe, Middle East and Africa
(‘EMEA’), in the third and fourth quarters there were early signs
of recovery in the UK, whilst trading in Continental Europe
remained flat. In the Americas and Asia Pacific, improved local
currency trading was impacted on conversion to sterling by the
fall in the US dollar.
Hotels turnover decreased £51m (3.3%) from £1,538m for
the 12 months ended 31 December 2002, to £1,487m for the
12 months ended 31 December 2003. While revenue rose
£7m (0.9%) in EMEA, the Americas and Asia Pacific were
negatively impacted by exchange rate movements. The decline
of the US dollar against sterling by 9.7% from the first to fourth
quarters resulted in sterling reported turnover in the Americas
finishing the 12 months down 7.7% and Asia Pacific down 10.9%.
Hotels pro forma operating profit before exceptional items for
the 12 months ended 31 December 2003 was £200m, down
16.3% (12 months ended 31 December 2002 £239m).
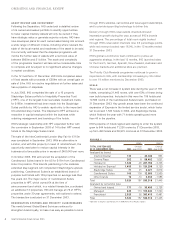
REORGANISATION
As part of the drive to deliver the key strategic priorities, IHG
has undertaken a fundamental review of the organisation.
The key objectives of the review were to:
• focus the organisation on the execution of its strategy;
• bring greater focus and establish clearer accountabilities;
• streamline decision making;
• reduce unnecessary work and inefficient processes; and
• provide greater teamwork and integration.
The redesign of the organisation was completed by the end of
January 2003 and has now been substantially implemented.
What remains to be done will be completed, as planned, by the
end of 2004. Regional executive teams had been established,
led by well respected hotel operators with at least 20 years of
industry experience each. In addition, the key global functions
have been centralised to allow maximum benefits of scale to
be achieved and global process improvements to be
progressed.
In March 2003, IHG announced that the reorganisation review
would deliver annualised savings by December 2004 of
$100m, against the budgeted 2003 base. Of these, actual
savings of $40m would be delivered by 31 December 2003,
with an annualised run rate of $75m.
By 31 December 2003, IHG had achieved actual savings of
$76m, with an annualised run rate of $110m. In view of
progress to date, annualised savings of $120m are now
anticipated to be delivered by December 2004.
Overheads in IHG comprise central and regional overheads,
as discussed separately in this OFR, together with regional
costs that directly relate to regional income streams. In the
year to 31 December 2003, these direct overheads totalled
$119m compared to $141m for the year ended 31 December
2002; savings again being primarily driven from the
reorganisation review.
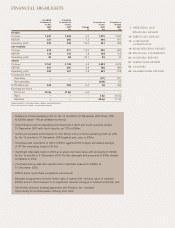
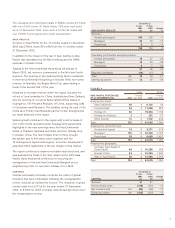
UNAUDITED PRO FORMA
12 months to 3 months to 3 months to
31 Dec 31 Dec 31 March 30 June 30 Sept 31 Dec 31 March 30 June 30 Sept 31 Dec
2003 2002 Change 2003 2003 2003 2003 2002 2002 2002 2002
HOTELS RESULTS £m £m % £m £m £m £m £m £m £m £m
Tu r n ov er :
Americas 525 569 -8 127 139 133 126 135 156 142 136
EMEA 807 800 1 175 198 217 217 183 210 204 203
Asia Pacific 114 128 -11 29 19 28 38 34 32 28 34
Central 41 41 – 10 11 9 11 10 10 11 10
1,487 1,538 -3 341 367 387 392 362 408 385 383
Operating profit before
exceptional items:
Americas 161 173 -7 32 50 47 32 38 54 47 34
EMEA 92 120 -23 13 19 36 24 21 35 42 22
Asia Pacific 12 26-544(3)3865510
Central (65) (80) -19 (20) (20) (10) (15) (17) (19) (22) (22)
200 239 -16 29 46 76 49 48 75 72 44
3