Holiday Inn 2003 Annual Report Download - page 41
Download and view the complete annual report
Please find page 41 of the 2003 Holiday Inn annual report below. You can navigate through the pages in the report by either clicking on the pages listed below, or by using the keyword search tool below to find specific information within the annual report.-
 1
1 -
2
-
3
-
4
-
5
-
6
-
7
-
8
-
9
-
10
-
11
-
12
-
13
-
14
-
15
-
16
-
17
-
18
-
19
-
20
-
21
-
22
-
23
-
24
-
25
-
26
-
27
-
28
-
29
-
30
-
 31
31 -
 32
32 -
 33
33 -
 34
34 -
 35
35 -
 36
36 -
 37
37 -
 38
38 -
 39
39 -
 40
40 -
 41
41 -
 42
42 -
 43
43 -
 44
44 -
 45
45 -
 46
46 -
 47
47 -
 48
48 -
 49
49 -
 50
50 -
 51
51 -
52
-
53
-
54
-
55
-
56
-
57
-
58
-
59
-
60
-
61
-
62
-
63
-
64
-
65
-
66
-
67
-
68
 |
 |

39
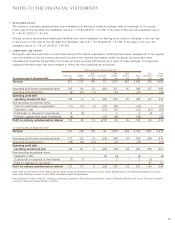
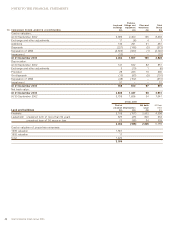
5 PENSIONS (CONTINUED)
2003 2002
15 months 12 months
UK US Total Total
Finance income £m £m £m £m
Expected return on pension scheme assets 49 5 54 80
Interest on pension scheme liabilities (53) (8) (61) (76)
Net (expense)/return (4) (3) (7) 4
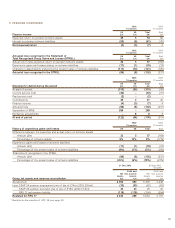
2003 2002
15 months 12 months
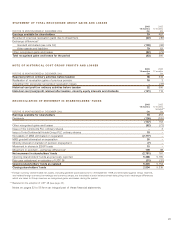
Actuarial loss recognised in the Statement of UK US Total Total
Total Recognised Group Gains and Losses (STRGL) £m £m £m £m
Actual return less expected return on pension scheme assets 32 5 37 (182)
Experience gains and losses arising on scheme liabilities (17) (1) (18) (23)
Changes in assumptions underlying the present value of scheme liabilities (111) (10) (121) (126)
Actuarial loss recognised in the STRGL (96) (6) (102) (331)
2003 2002
15 months 12 months
UK US Total Total
Movement in deficit during the period £m £m £m £m
At start of period (315) (55) (370) (55)
Current service cost (32) – (32) (31)
Past service cost (2) – (2) –
Contributions 39 2 41 40
Finance income (4) (3) (7) 4
Actuarial loss (96) (6) (102) (331)
Separation of MAB 288 – 288 –
Exchange adjustments –883
At end of period (122) (54) (176) (370)
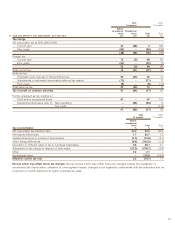
2003 2002
15 months 12 months
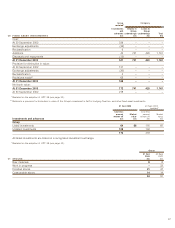
History of experience gains and losses UK US Total Total
Difference between the expected and actual return on scheme assets
Amount (£m) 32 5 37 (182)
Percentage of scheme assets 9% 10% 9% (17%)
Experience gains and losses on scheme liabilities
Amount (£m) (17) (1) (18) (23)
Percentage of the present value of scheme liabilities (4%) (1%) (3%) (2%)
Total amount recognised in the STRGL
Amount (£m) (96) (6) (102) (331)
Percentage of the present value of scheme liabilities (20%) (6%) (18%) (23%)
31 Dec 2003 30 Sept 2002
restated*
Profit and Profit and
Net loss account Net loss account
assets reserve assets reserve
Group net assets and reserves reconciliation £m £m £m £m
As reported 2,554 390 5,335 2,448
Less: SSAP 24 pension prepayment (net of tax of £14m (2002 £26m)) (33) (33) (62) (62)
SSAP 24 pension provision (net of tax of £16m (2002 £14m)) 30 30 25 25
FRS 17 net pension liability (118) (118) (254) (254)
Restated for FRS 17 2,433 269 5,044 2,157
* Restated on the adoption of UITF 38 (see page 32).