HSBC 2009 Annual Report Download - page 90
Download and view the complete annual report
Please find page 90 of the 2009 HSBC annual report below. You can navigate through the pages in the report by either clicking on the pages listed below, or by using the keyword search tool below to find specific information within the annual report.-
 1
1 -
2
-
3
-
4
-
5
-
6
-
7
-
8
-
9
-
10
-
11
-
12
-
13
-
14
-
15
-
16
-
17
-
18
-
19
-
20
-
21
-
22
-
23
-
24
-
25
-
26
-
27
-
28
-
29
-
30
-
31
-
32
-
33
-
34
-
35
-
36
-
37
-
38
-
39
-
40
-
41
-
42
-
43
-
44
-
45
-
46
-
47
-
48
-
49
-
50
-
51
-
52
-
53
-
54
-
55
-
56
-
57
-
58
-
59
-
60
-
61
-
62
-
63
-
64
-
65
-
66
-
67
-
68
-
69
-
70
-
71
-
72
-
73
-
74
-
75
-
76
-
77
-
78
-
79
-
 80
80 -
 81
81 -
 82
82 -
 83
83 -
 84
84 -
 85
85 -
 86
86 -
 87
87 -
 88
88 -
 89
89 -
 90
90 -
 91
91 -
 92
92 -
 93
93 -
 94
94 -
 95
95 -
 96
96 -
 97
97 -
 98
98 -
 99
99 -
 100
100 -
101
-
102
-
103
-
104
-
105
-
106
-
107
-
108
-
109
-
110
-
111
-
112
-
113
-
114
-
115
-
116
-
117
-
118
-
119
-
120
-
121
-
122
-
123
-
124
-
125
-
126
-
127
-
128
-
129
-
130
-
131
-
132
-
133
-
134
-
135
-
136
-
137
-
138
-
139
-
140
-
141
-
142
-
143
-
144
-
145
-
146
-
147
-
148
-
149
-
150
-
151
-
152
-
153
-
154
-
155
-
156
-
157
-
158
-
159
-
160
-
161
-
162
-
163
-
164
-
165
-
166
-
167
-
168
-
169
-
170
-
171
-
172
-
173
-
174
-
175
-
176
-
177
-
178
-
179
-
180
-
181
-
182
-
183
-
184
-
185
-
186
-
187
-
188
-
189
-
190
-
191
-
192
-
193
-
194
-
195
-
196
-
197
-
198
-
199
-
200
-
201
-
202
-
203
-
204
-
205
-
206
-
207
-
208
-
209
-
210
-
211
-
212
-
213
-
214
-
215
-
216
-
217
-
218
-
219
-
220
-
221
-
222
-
223
-
224
-
225
-
226
-
227
-
228
-
229
-
230
-
231
-
232
-
233
-
234
-
235
-
236
-
237
-
238
-
239
-
240
-
241
-
242
-
243
-
244
-
245
-
246
-
247
-
248
-
249
-
250
-
251
-
252
-
253
-
254
-
255
-
256
-
257
-
258
-
259
-
260
-
261
-
262
-
263
-
264
-
265
-
266
-
267
-
268
-
269
-
270
-
271
-
272
-
273
-
274
-
275
-
276
-
277
-
278
-
279
-
280
-
281
-
282
-
283
-
284
-
285
-
286
-
287
-
288
-
289
-
290
-
291
-
292
-
293
-
294
-
295
-
296
-
297
-
298
-
299
-
300
-
301
-
302
-
303
-
304
-
305
-
306
-
307
-
308
-
309
-
310
-
311
-
312
-
313
-
314
-
315
-
316
-
317
-
318
-
319
-
320
-
321
-
322
-
323
-
324
-
325
-
326
-
327
-
328
-
329
-
330
-
331
-
332
-
333
-
334
-
335
-
336
-
337
-
338
-
339
-
340
-
341
-
342
-
343
-
344
-
345
-
346
-
347
-
348
-
349
-
350
-
351
-
352
-
353
-
354
-
355
-
356
-
357
-
358
-
359
-
360
-
361
-
362
-
363
-
364
-
365
-
366
-
367
-
368
-
369
-
370
-
371
-
372
-
373
-
374
-
375
-
376
-
377
-
378
-
379
-
380
-
381
-
382
-
383
-
384
-
385
-
386
-
387
-
388
-
389
-
390
-
391
-
392
-
393
-
394
-
395
-
396
-
397
-
398
-
399
-
400
-
401
-
402
-
403
-
404
-
405
-
406
-
407
-
408
-
409
-
410
-
411
-
412
-
413
-
414
-
415
-
416
-
417
-
418
-
419
-
420
-
421
-
422
-
423
-
424
-
425
-
426
-
427
-
428
-
429
-
430
-
431
-
432
-
433
-
434
-
435
-
436
-
437
-
438
-
439
-
440
-
441
-
442
-
443
-
444
-
445
-
446
-
447
-
448
-
449
-
450
-
451
-
452
-
453
-
454
-
455
-
456
-
457
-
458
-
459
-
460
-
461
-
462
-
463
-
464
-
465
-
466
-
467
-
468
-
469
-
470
-
471
-
472
-
473
-
474
-
475
-
476
-
477
-
478
-
479
-
480
-
481
-
482
-
483
-
484
-
485
-
486
-
487
-
488
-
489
-
490
-
491
-
492
-
493
-
494
-
495
-
496
-
497
-
498
-
499
-
500
-
501
-
502
-
503
-
504
 |
 |

HSBC HOLDINGS PLC
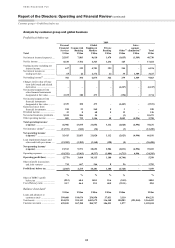
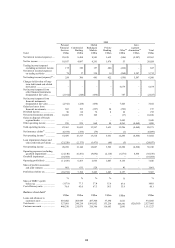
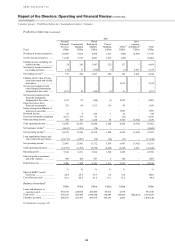
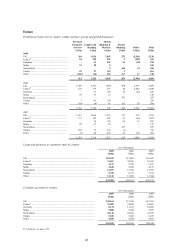
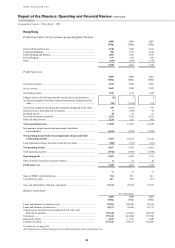
Report of the Directors: Operating and Financial Review (continued)
Geographical regions > Europe > 2009
88
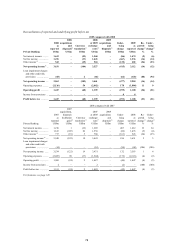
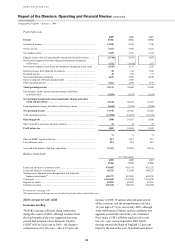
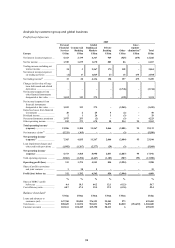
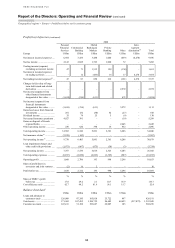
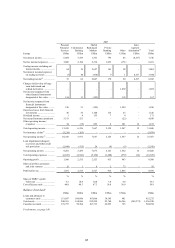
Profit before tax
2009 2008 2007
Europe US$m US$m US$m
Net interest income .......................................................................................... 12,268 9,696 7,746
Net fee income ................................................................................................. 6,267 7,492 8,431
Net trading income .......................................................................................... 5,459 5,357 6,943
Changes in fair value of long-term debt issued and related derivatives ......... (2,746) 2,939 1,059
Net income/(expense) from other financial instruments designated
at fair value ................................................................................................. 1,321 (1,826) 167
Net income/(expense) from financial instruments designated at fair value ... (1,425) 1,113 1,226
Gains less losses from financial investments .................................................. 50 418 1,326
Dividend income .............................................................................................. 29 130 171
Net earned insurance premiums ...................................................................... 4,223 5,299 4,010
Gains on disposal of French regional banks ................................................... – 2,445 –
Other operating income ................................................................................... 2,262 2,096 1,193
Total operating income ................................................................................. 29,133 34,046 31,046
Net insurance claims incurred and movement in liabilities
to policyholders .......................................................................................... (5,589) (3,367) (3,479)
Net operating income before loan impairment charges and other
credit risk provisions ................................................................................ 23,544 30,679 27,567
Loan impairment charges and other credit risk provisions ............................. (5,568) (3,754) (2,542)
Net operating income .................................................................................... 17,976 26,925 25,025
Total operating expenses ................................................................................. (13,988) (16,072) (16,525)
Operating profit ............................................................................................. 3,988 10,853 8,500
Share of profit in associates and joint ventures ............................................... 21 16 95
Profit before tax ............................................................................................. 4,009 10,869 8,595
% % %
Share of HSBC’s profit before tax .................................................................. 56.7 116.7 35.5
Cost efficiency ratio ........................................................................................ 59.4 52.4 59.9
Year-end staff numbers (full-time equivalent) ................................................ 76,703 82,093 82,166
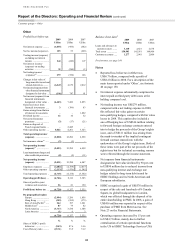
Balance sheet data41
At 31 December
2009 2008 2007
US$m US$m US$m
Loans and advances to customers (net) ........................................................... 439,481 426,191 452,275
Loans and advances to banks (net) .................................................................. 65,521 61,949 104,527
Trading assets, financial assets designated at fair value and
financial investments49 ............................................................................... 450,727
433,885 445,258
Total assets ...................................................................................................... 1,268,600 1,392,049 1,256,220
Deposits by banks ............................................................................................ 89,893 80,847 87,491
Customer accounts ........................................................................................... 495,019 502,476 504,954
For footnotes, see page 149.
All commentaries on Europe are on an underlying basis unless stated otherwise.
2009 compared with 2008
Economic briefing
The UK economy suffered a sharp contraction
during the course of 2009, although evidence from
the final months of the year suggested that some
growth had resumed. Gross Domestic Product
(‘GDP’) fell by 5 per cent in 2009 – the sharpest
contraction in over 60 years – after a 0.5 per cent
increase in 2008. Weakness affected most sectors
of the economy, and the unemployment rate hit a
13-year high of 7.9 per cent in July 2009, although
some stabilisation of labour market conditions was
apparent towards the end of the year. Consumer
Price Index (‘CPI’) inflation reached a five-year
low of 1.1 per cent in September 2009 before
moving towards the Bank of England’s 2 per cent
target by the end of the year. Nominal house prices