HSBC 2009 Annual Report Download - page 123
Download and view the complete annual report
Please find page 123 of the 2009 HSBC annual report below. You can navigate through the pages in the report by either clicking on the pages listed below, or by using the keyword search tool below to find specific information within the annual report.-
 1
1 -
2
-
3
-
4
-
5
-
6
-
7
-
8
-
9
-
10
-
11
-
12
-
13
-
14
-
15
-
16
-
17
-
18
-
19
-
20
-
21
-
22
-
23
-
24
-
25
-
26
-
27
-
28
-
29
-
30
-
31
-
32
-
33
-
34
-
35
-
36
-
37
-
38
-
39
-
40
-
41
-
42
-
43
-
44
-
45
-
46
-
47
-
48
-
49
-
50
-
51
-
52
-
53
-
54
-
55
-
56
-
57
-
58
-
59
-
60
-
61
-
62
-
63
-
64
-
65
-
66
-
67
-
68
-
69
-
70
-
71
-
72
-
73
-
74
-
75
-
76
-
77
-
78
-
79
-
80
-
81
-
82
-
83
-
84
-
85
-
86
-
87
-
88
-
89
-
90
-
91
-
92
-
93
-
94
-
95
-
96
-
97
-
98
-
99
-
100
-
101
-
102
-
103
-
104
-
105
-
106
-
107
-
108
-
109
-
110
-
111
-
112
-
 113
113 -
 114
114 -
 115
115 -
 116
116 -
 117
117 -
 118
118 -
 119
119 -
 120
120 -
 121
121 -
 122
122 -
 123
123 -
 124
124 -
 125
125 -
 126
126 -
 127
127 -
 128
128 -
 129
129 -
 130
130 -
 131
131 -
 132
132 -
 133
133 -
134
-
135
-
136
-
137
-
138
-
139
-
140
-
141
-
142
-
143
-
144
-
145
-
146
-
147
-
148
-
149
-
150
-
151
-
152
-
153
-
154
-
155
-
156
-
157
-
158
-
159
-
160
-
161
-
162
-
163
-
164
-
165
-
166
-
167
-
168
-
169
-
170
-
171
-
172
-
173
-
174
-
175
-
176
-
177
-
178
-
179
-
180
-
181
-
182
-
183
-
184
-
185
-
186
-
187
-
188
-
189
-
190
-
191
-
192
-
193
-
194
-
195
-
196
-
197
-
198
-
199
-
200
-
201
-
202
-
203
-
204
-
205
-
206
-
207
-
208
-
209
-
210
-
211
-
212
-
213
-
214
-
215
-
216
-
217
-
218
-
219
-
220
-
221
-
222
-
223
-
224
-
225
-
226
-
227
-
228
-
229
-
230
-
231
-
232
-
233
-
234
-
235
-
236
-
237
-
238
-
239
-
240
-
241
-
242
-
243
-
244
-
245
-
246
-
247
-
248
-
249
-
250
-
251
-
252
-
253
-
254
-
255
-
256
-
257
-
258
-
259
-
260
-
261
-
262
-
263
-
264
-
265
-
266
-
267
-
268
-
269
-
270
-
271
-
272
-
273
-
274
-
275
-
276
-
277
-
278
-
279
-
280
-
281
-
282
-
283
-
284
-
285
-
286
-
287
-
288
-
289
-
290
-
291
-
292
-
293
-
294
-
295
-
296
-
297
-
298
-
299
-
300
-
301
-
302
-
303
-
304
-
305
-
306
-
307
-
308
-
309
-
310
-
311
-
312
-
313
-
314
-
315
-
316
-
317
-
318
-
319
-
320
-
321
-
322
-
323
-
324
-
325
-
326
-
327
-
328
-
329
-
330
-
331
-
332
-
333
-
334
-
335
-
336
-
337
-
338
-
339
-
340
-
341
-
342
-
343
-
344
-
345
-
346
-
347
-
348
-
349
-
350
-
351
-
352
-
353
-
354
-
355
-
356
-
357
-
358
-
359
-
360
-
361
-
362
-
363
-
364
-
365
-
366
-
367
-
368
-
369
-
370
-
371
-
372
-
373
-
374
-
375
-
376
-
377
-
378
-
379
-
380
-
381
-
382
-
383
-
384
-
385
-
386
-
387
-
388
-
389
-
390
-
391
-
392
-
393
-
394
-
395
-
396
-
397
-
398
-
399
-
400
-
401
-
402
-
403
-
404
-
405
-
406
-
407
-
408
-
409
-
410
-
411
-
412
-
413
-
414
-
415
-
416
-
417
-
418
-
419
-
420
-
421
-
422
-
423
-
424
-
425
-
426
-
427
-
428
-
429
-
430
-
431
-
432
-
433
-
434
-
435
-
436
-
437
-
438
-
439
-
440
-
441
-
442
-
443
-
444
-
445
-
446
-
447
-
448
-
449
-
450
-
451
-
452
-
453
-
454
-
455
-
456
-
457
-
458
-
459
-
460
-
461
-
462
-
463
-
464
-
465
-
466
-
467
-
468
-
469
-
470
-
471
-
472
-
473
-
474
-
475
-
476
-
477
-
478
-
479
-
480
-
481
-
482
-
483
-
484
-
485
-
486
-
487
-
488
-
489
-
490
-
491
-
492
-
493
-
494
-
495
-
496
-
497
-
498
-
499
-
500
-
501
-
502
-
503
-
504
 |
 |
121
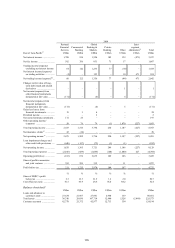
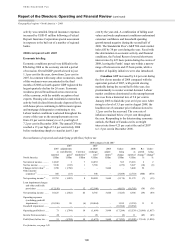
2008 compared with 2007
Economic briefing
The economies of the Middle East performed
strongly for much of 2008, although inflationary
concerns were a feature for much of the year, driven
by the surge in oil prices to record levels and private
and public investment expenditure. High oil
revenues continued to boost fiscal and current
account surpluses throughout the region during
2008, although the impact of the decline in oil prices
during the final months of the year, together with the
OPEC-mandated production cuts, are expected to
lead to slower growth in 2009.
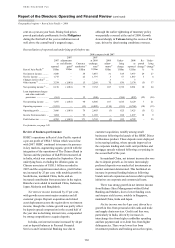
Review of business performance
HSBC’s operations in the Middle East performed
strongly, reporting a pre-tax profit of US$1.7 billion,
an increase of 33 per cent on an underlying basis.
Record oil prices which peaked in July 2008 boosted
domestic spending on infrastructure and real estate
in the first half of 2008. The resulting increase in
demand for credit was reflected by growth in both
volumes and the average loan size. HSBC also
successfully launched new banking products across
the region, in addition to growing the Premier
customer base. Business volume growth and wider
asset spreads drove higher net interest income, and
fee income rose as volumes of cards and trade
products grew.
As global financial conditions began to worsen
in the second half of 2008, liquidity in the region
declined, which combined with deteriorating
consumer confidence, adversely impacted real-estate
prices. This triggered an increase in construction-
related unemployment as large developments were
cancelled or suspended resulting in an increase in
loan impairment charges.
Net interest income increased by 42 per cent
driven by balance sheet growth in the region.
In Personal Financial Services, the strong
lending growth was driven by increased balances in
unsecured lending as both cards in circulation and
cardholder spending drove higher card balances.
Similarly new personal loan products were launched.
Mortgage balances rose in the UAE, driven by
increased customer demand. The increase in
Commercial Banking lending balances reflected a
strong rise in corporate lending aligned to trade and
infrastructure investments. Asset spreads benefited
from a decline in local base rates following US
dollar interest rate cuts, which resulted in a lower
cost of funds.
Growth in personal customer deposits was
driven by a significant increase in the number of
e-saver and Premier accounts. Deposit spreads
narrowed due to declining market interest rates in the
region.
There was strong growth in net interest income
from Balance Sheet Management, due to early
positioning in anticipation of lower market interest
rates.
Net fee income rose by 46 per cent driven by
higher fees in Global Banking and Markets as
increased interest from foreign investors and asset
growth drove securities services income. Credit card
fees rose, driven by increases in interchange fees
from higher cardholder spending, and late payment
and over-limit fees from higher delinquencies. Fee
income from credit facilities rose reflecting increases
in the numbers of customers. Trade and supply chain
services contributed strongly to fee income primarily
in the construction and infrastructure industries.
Trading income rose by 34 per cent resulting
from market uncertainty regarding possible currency
revaluations which drove volatility and together with
robust client demand, led to higher foreign exchange
income.
Loan impairment charges rose significantly,
albeit from a low base, to US$279 million as a result
of increased delinquency rates on higher personal
unsecured lending in the UAE. A deterioration in
credit conditions also led to increased charges in
Commercial Banking.
Operating expenses were 23 per cent higher,
reflecting substantially increased levels of operating
volumes, related headcount growth and wage
inflation driven by competitive labour market
conditions. Non-staff costs rose as a result of higher
premises costs, and increased marketing expenditure
in line with new product launches.
Profit from associates and joint ventures rose by
25 per cent as the Group’s share of income from the
Saudi British Bank increased as a result of higher fee
income from cards, account management and trade-
related businesses. These were partly offset by
higher operating expenditure resulting from branch
expansion, increased investment in technology and
higher performance-related pay.