HSBC 2009 Annual Report Download - page 120
Download and view the complete annual report
Please find page 120 of the 2009 HSBC annual report below. You can navigate through the pages in the report by either clicking on the pages listed below, or by using the keyword search tool below to find specific information within the annual report.-
 1
1 -
2
-
3
-
4
-
5
-
6
-
7
-
8
-
9
-
10
-
11
-
12
-
13
-
14
-
15
-
16
-
17
-
18
-
19
-
20
-
21
-
22
-
23
-
24
-
25
-
26
-
27
-
28
-
29
-
30
-
31
-
32
-
33
-
34
-
35
-
36
-
37
-
38
-
39
-
40
-
41
-
42
-
43
-
44
-
45
-
46
-
47
-
48
-
49
-
50
-
51
-
52
-
53
-
54
-
55
-
56
-
57
-
58
-
59
-
60
-
61
-
62
-
63
-
64
-
65
-
66
-
67
-
68
-
69
-
70
-
71
-
72
-
73
-
74
-
75
-
76
-
77
-
78
-
79
-
80
-
81
-
82
-
83
-
84
-
85
-
86
-
87
-
88
-
89
-
90
-
91
-
92
-
93
-
94
-
95
-
96
-
97
-
98
-
99
-
100
-
101
-
102
-
103
-
104
-
105
-
106
-
107
-
108
-
109
-
 110
110 -
 111
111 -
 112
112 -
 113
113 -
 114
114 -
 115
115 -
 116
116 -
 117
117 -
 118
118 -
 119
119 -
 120
120 -
 121
121 -
 122
122 -
 123
123 -
 124
124 -
 125
125 -
 126
126 -
 127
127 -
 128
128 -
 129
129 -
 130
130 -
131
-
132
-
133
-
134
-
135
-
136
-
137
-
138
-
139
-
140
-
141
-
142
-
143
-
144
-
145
-
146
-
147
-
148
-
149
-
150
-
151
-
152
-
153
-
154
-
155
-
156
-
157
-
158
-
159
-
160
-
161
-
162
-
163
-
164
-
165
-
166
-
167
-
168
-
169
-
170
-
171
-
172
-
173
-
174
-
175
-
176
-
177
-
178
-
179
-
180
-
181
-
182
-
183
-
184
-
185
-
186
-
187
-
188
-
189
-
190
-
191
-
192
-
193
-
194
-
195
-
196
-
197
-
198
-
199
-
200
-
201
-
202
-
203
-
204
-
205
-
206
-
207
-
208
-
209
-
210
-
211
-
212
-
213
-
214
-
215
-
216
-
217
-
218
-
219
-
220
-
221
-
222
-
223
-
224
-
225
-
226
-
227
-
228
-
229
-
230
-
231
-
232
-
233
-
234
-
235
-
236
-
237
-
238
-
239
-
240
-
241
-
242
-
243
-
244
-
245
-
246
-
247
-
248
-
249
-
250
-
251
-
252
-
253
-
254
-
255
-
256
-
257
-
258
-
259
-
260
-
261
-
262
-
263
-
264
-
265
-
266
-
267
-
268
-
269
-
270
-
271
-
272
-
273
-
274
-
275
-
276
-
277
-
278
-
279
-
280
-
281
-
282
-
283
-
284
-
285
-
286
-
287
-
288
-
289
-
290
-
291
-
292
-
293
-
294
-
295
-
296
-
297
-
298
-
299
-
300
-
301
-
302
-
303
-
304
-
305
-
306
-
307
-
308
-
309
-
310
-
311
-
312
-
313
-
314
-
315
-
316
-
317
-
318
-
319
-
320
-
321
-
322
-
323
-
324
-
325
-
326
-
327
-
328
-
329
-
330
-
331
-
332
-
333
-
334
-
335
-
336
-
337
-
338
-
339
-
340
-
341
-
342
-
343
-
344
-
345
-
346
-
347
-
348
-
349
-
350
-
351
-
352
-
353
-
354
-
355
-
356
-
357
-
358
-
359
-
360
-
361
-
362
-
363
-
364
-
365
-
366
-
367
-
368
-
369
-
370
-
371
-
372
-
373
-
374
-
375
-
376
-
377
-
378
-
379
-
380
-
381
-
382
-
383
-
384
-
385
-
386
-
387
-
388
-
389
-
390
-
391
-
392
-
393
-
394
-
395
-
396
-
397
-
398
-
399
-
400
-
401
-
402
-
403
-
404
-
405
-
406
-
407
-
408
-
409
-
410
-
411
-
412
-
413
-
414
-
415
-
416
-
417
-
418
-
419
-
420
-
421
-
422
-
423
-
424
-
425
-
426
-
427
-
428
-
429
-
430
-
431
-
432
-
433
-
434
-
435
-
436
-
437
-
438
-
439
-
440
-
441
-
442
-
443
-
444
-
445
-
446
-
447
-
448
-
449
-
450
-
451
-
452
-
453
-
454
-
455
-
456
-
457
-
458
-
459
-
460
-
461
-
462
-
463
-
464
-
465
-
466
-
467
-
468
-
469
-
470
-
471
-
472
-
473
-
474
-
475
-
476
-
477
-
478
-
479
-
480
-
481
-
482
-
483
-
484
-
485
-
486
-
487
-
488
-
489
-
490
-
491
-
492
-
493
-
494
-
495
-
496
-
497
-
498
-
499
-
500
-
501
-
502
-
503
-
504
 |
 |

HSBC HOLDINGS PLC
Report of the Directors: Operating and Financial Review (continued)
Geographical regions > Middle East > 2009
118
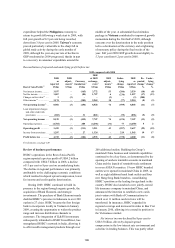
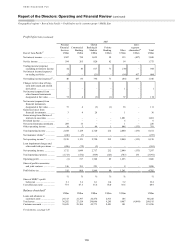
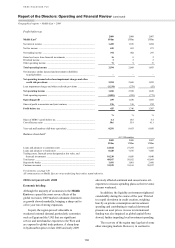
Profit before tax
2009 2008 2007
Middle East27 US$m US$m US$m
Net interest income .......................................................................................... 1,485 1,556 1,094
Net fee income ................................................................................................. 625 691 471
Net trading income .......................................................................................... 394 402 297
Gains less losses from financial investments .................................................. 16 8 2
Dividend income .............................................................................................. 3 2 2
Other operating income ................................................................................... 71 9 17
Total operating income ................................................................................. 2,594 2,668 1,883
Net insurance claims incurred and movement in liabilities
to policyholders .......................................................................................... – – –
Net operating income before loan impairment charges and other
credit risk provisions ................................................................................ 2,594 2,668 1,883
Loan impairment charges and other credit risk provisions ............................. (1,334) (279) (55)
Net operating income .................................................................................... 1,260 2,389 1,828
Total operating expenses ................................................................................. (1,001) (959) (773)
Operating profit ............................................................................................. 259 1,430 1,055
Share of profit in associates and joint ventures ............................................... 196 316 252
Profit before tax ............................................................................................. 455 1,746 1,307
% % %
Share of HSBC’s profit before tax .................................................................. 6.4 18.8 5.4
Cost efficiency ratio ........................................................................................ 38.6 35.9 41.1
Year-end staff numbers (full-time equivalent) ................................................ 8,281 8,453 8,050
Balance sheet data41
At 31 December
2009
US$m
2008
US$m
2007
US$m
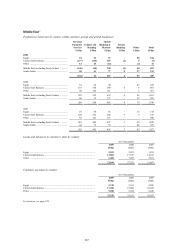
Loans and advances to customers (net) ........................................................... 22,844 27,295 21,607
Loans and advances to banks (net) .................................................................. 8,420 7,476 7,488
Trading assets, financial assets designated at fair value, and
financial investments ................................................................................... 10,230 8,056 9,840
Total assets ...................................................................................................... 48,107 50,952 45,669
Deposits by banks ............................................................................................ 1,491 1,001 2,460
Customer accounts ........................................................................................... 32,529 35,165 30,937
For footnotes, see page 149.
All commentaries on Middle East are on an underlying basis unless stated otherwise.
2009 compared with 2008
Economic briefing
Although the majority of economies in the Middle
East were spared the most severe effects of the
global recession, 2009 marked a dramatic downturn
as growth slowed markedly, bringing a sharp end to
a five-year run of strong expansion.
In part, the region proved vulnerable to
weakened external demand, particularly economies
such as Egypt and the UAE that are significant
service and merchandise exporters to the West and
are exposed to global trade patterns. A sharp drop
in hydrocarbon prices in late 2008 and early 2009
adversely affected sentiment and caused some oil-
exporters to reassess spending plans as their revenue
streams weakened.
In addition, the liquidity environment tightened
considerably during the course of the year. This led
to a rapid slowdown in credit creation, weighing
heavily on private consumption and investment
spending and contributing to marked downward
pressure on asset prices. Access to international
funding was also impaired as global capital flows
slowed, further impeding local investment spending.
The recovery of the region may lag that of some
other emerging markets. However, in contrast to