HSBC 2009 Annual Report Download - page 102
Download and view the complete annual report
Please find page 102 of the 2009 HSBC annual report below. You can navigate through the pages in the report by either clicking on the pages listed below, or by using the keyword search tool below to find specific information within the annual report.-
 1
1 -
2
-
3
-
4
-
5
-
6
-
7
-
8
-
9
-
10
-
11
-
12
-
13
-
14
-
15
-
16
-
17
-
18
-
19
-
20
-
21
-
22
-
23
-
24
-
25
-
26
-
27
-
28
-
29
-
30
-
31
-
32
-
33
-
34
-
35
-
36
-
37
-
38
-
39
-
40
-
41
-
42
-
43
-
44
-
45
-
46
-
47
-
48
-
49
-
50
-
51
-
52
-
53
-
54
-
55
-
56
-
57
-
58
-
59
-
60
-
61
-
62
-
63
-
64
-
65
-
66
-
67
-
68
-
69
-
70
-
71
-
72
-
73
-
74
-
75
-
76
-
77
-
78
-
79
-
80
-
81
-
82
-
83
-
84
-
85
-
86
-
87
-
88
-
89
-
90
-
91
-
 92
92 -
 93
93 -
 94
94 -
 95
95 -
 96
96 -
 97
97 -
 98
98 -
 99
99 -
 100
100 -
 101
101 -
 102
102 -
 103
103 -
 104
104 -
 105
105 -
 106
106 -
 107
107 -
 108
108 -
 109
109 -
 110
110 -
 111
111 -
 112
112 -
113
-
114
-
115
-
116
-
117
-
118
-
119
-
120
-
121
-
122
-
123
-
124
-
125
-
126
-
127
-
128
-
129
-
130
-
131
-
132
-
133
-
134
-
135
-
136
-
137
-
138
-
139
-
140
-
141
-
142
-
143
-
144
-
145
-
146
-
147
-
148
-
149
-
150
-
151
-
152
-
153
-
154
-
155
-
156
-
157
-
158
-
159
-
160
-
161
-
162
-
163
-
164
-
165
-
166
-
167
-
168
-
169
-
170
-
171
-
172
-
173
-
174
-
175
-
176
-
177
-
178
-
179
-
180
-
181
-
182
-
183
-
184
-
185
-
186
-
187
-
188
-
189
-
190
-
191
-
192
-
193
-
194
-
195
-
196
-
197
-
198
-
199
-
200
-
201
-
202
-
203
-
204
-
205
-
206
-
207
-
208
-
209
-
210
-
211
-
212
-
213
-
214
-
215
-
216
-
217
-
218
-
219
-
220
-
221
-
222
-
223
-
224
-
225
-
226
-
227
-
228
-
229
-
230
-
231
-
232
-
233
-
234
-
235
-
236
-
237
-
238
-
239
-
240
-
241
-
242
-
243
-
244
-
245
-
246
-
247
-
248
-
249
-
250
-
251
-
252
-
253
-
254
-
255
-
256
-
257
-
258
-
259
-
260
-
261
-
262
-
263
-
264
-
265
-
266
-
267
-
268
-
269
-
270
-
271
-
272
-
273
-
274
-
275
-
276
-
277
-
278
-
279
-
280
-
281
-
282
-
283
-
284
-
285
-
286
-
287
-
288
-
289
-
290
-
291
-
292
-
293
-
294
-
295
-
296
-
297
-
298
-
299
-
300
-
301
-
302
-
303
-
304
-
305
-
306
-
307
-
308
-
309
-
310
-
311
-
312
-
313
-
314
-
315
-
316
-
317
-
318
-
319
-
320
-
321
-
322
-
323
-
324
-
325
-
326
-
327
-
328
-
329
-
330
-
331
-
332
-
333
-
334
-
335
-
336
-
337
-
338
-
339
-
340
-
341
-
342
-
343
-
344
-
345
-
346
-
347
-
348
-
349
-
350
-
351
-
352
-
353
-
354
-
355
-
356
-
357
-
358
-
359
-
360
-
361
-
362
-
363
-
364
-
365
-
366
-
367
-
368
-
369
-
370
-
371
-
372
-
373
-
374
-
375
-
376
-
377
-
378
-
379
-
380
-
381
-
382
-
383
-
384
-
385
-
386
-
387
-
388
-
389
-
390
-
391
-
392
-
393
-
394
-
395
-
396
-
397
-
398
-
399
-
400
-
401
-
402
-
403
-
404
-
405
-
406
-
407
-
408
-
409
-
410
-
411
-
412
-
413
-
414
-
415
-
416
-
417
-
418
-
419
-
420
-
421
-
422
-
423
-
424
-
425
-
426
-
427
-
428
-
429
-
430
-
431
-
432
-
433
-
434
-
435
-
436
-
437
-
438
-
439
-
440
-
441
-
442
-
443
-
444
-
445
-
446
-
447
-
448
-
449
-
450
-
451
-
452
-
453
-
454
-
455
-
456
-
457
-
458
-
459
-
460
-
461
-
462
-
463
-
464
-
465
-
466
-
467
-
468
-
469
-
470
-
471
-
472
-
473
-
474
-
475
-
476
-
477
-
478
-
479
-
480
-
481
-
482
-
483
-
484
-
485
-
486
-
487
-
488
-
489
-
490
-
491
-
492
-
493
-
494
-
495
-
496
-
497
-
498
-
499
-
500
-
501
-
502
-
503
-
504
 |
 |

HSBC HOLDINGS PLC
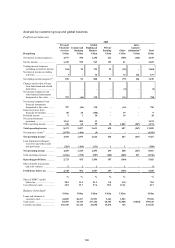
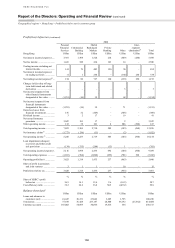
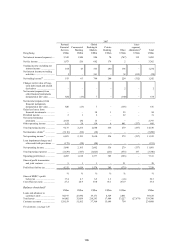
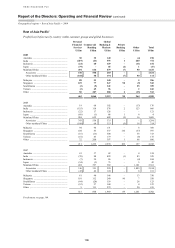
Report of the Directors: Operating and Financial Review (continued)
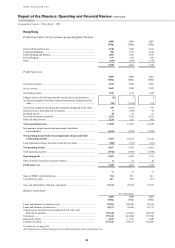
Geographical regions > Hong Kong > 2009 / 2008
100
Banking lending activity increased in the second half
of the year. Throughout this challenging period for
trade, HSBC continued to support local business
through its HK$20 billion (US$2.6 billion) global
loan fund for smaller businesses. These facilities
were fully utilised by over 8,600 companies at
31 December 2009.
As residential property prices increased,
personal lending volumes rose, and HSBC
consolidated its mortgage market share by
originating significant volumes of new mortgages.
HSBC led this market with a 38 per cent share of
new loan drawdowns with an average loan-to-value
ratio of 58 per cent on new business. Asset spreads
improved as a result of selective risk-based
repricing, notably in cards, while funding costs
fell in the low interest rate environment.
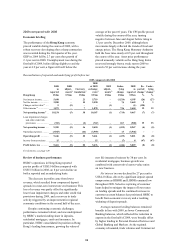
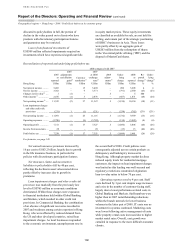
Pre-tax profit declined by 8 per cent to
US$5.0 billion as deposit spreads
compressed in the near-zero interest rate
environment.
HSBC continued to increase market share in
savings and deposit accounts, and balances grew
following a series of deposit acquisition campaigns.
In Personal Financial Services, customer account
balances rose by 15 per cent and Premier customer
numbers grew to over 380,000. Strong growth in
Commercial Banking was driven by a rise in
customer numbers, also supported by a series of
deposit acquisition campaigns and increased
liquidity in the region.
Overall, deposit balances grew by 10 per cent.
Liability spreads remained under severe pressure
throughout 2009, however.
Net fee income increased by 3 per cent with an
increase in IPO underwriting fees in the second half
of the year, triggered by improved investor sentiment
and a recovery in equity markets. Personal Financial
Services customers’ preference for deposit products
rather than equity-linked products in the first half of
the year reversed as equity markets recovered in the
second half of 2009, resulting in a recovery in
revenue generated from unit trusts, wealth
management, custody and other investment products.
Similarly, the increase in trade flows in the second
half of 2009 affected trade-related fee income in
Commercial Banking.
Trading income increased by 2 per cent,
primarily due to increased volumes of bond trading
and wider margins on market making activities. The
non-recurrence of US$0.2 billion of write-downs on
a legacy monoline exposure also contributed to the
rise. Foreign exchange trading revenue decreased
from the exceptional results reported in 2008,
reflecting the lower market volatility and a decline
in customer volumes. Interest on trading assets
declined due to a reduced holding of trading debt
securities.
Income of US$0.8 billion was generated from
financial instruments designated at fair value,
compared with an expense of US$1.2 billion in
2008. The positive movement in fair value was
primarily driven by equity market-related gains in
unit-linked insurance products. To the extent that
these gains were attributed to policyholders, there
was a corresponding increase in net insurance claims
incurred and movement in liabilities to
policyholders.
Net earned premiums increased by 13 per cent
to US$3.7 billion due to strong sales of both existing
and new products, including a life insurance product
designed for high net worth individuals, all of which
contributed to a rise in market share. The proportion
of regular premium policies grew and sales of
investment-linked insurance products began to
improve in the second half of the year. HSBC
retained its market leadership position in the regular-
premium individual-life new business. The growth
in insurance business also resulted in higher net
insurance claims incurred and movement in
liabilities to policyholders.
Gains less losses from financial investments
moved from a loss of US$310 million to a net gain
of US$9 million, mainly due to the non-recurrence
of impairments against available-for-sale equity
investments following declines in market valuations
in 2008. The loss recognised in 2008 on the equity
investments concerned was partially recovered in
2009 but this gain was reflected in reserves rather
than reversing through the income statement.
Other operating income of US$1.3 billion
was 55 per cent higher than in 2008, reflecting a
positive movement in PVIF driven largely by an
increase in insurance sales to new customers. A gain
of US$110 million was recognised in respect of the
disposal of a property in Hong Kong.
Loan impairment charges and other credit risk
provisions fell by 35 per cent to US$0.5 billion, as
the credit environment was more stable in 2009
following deterioration in the second half of 2008.
The high level of credit risk provisions and loan
impairment charges taken in 2008 against financial
institutions and export-led customers moderated in
2009 as credit conditions recovered and international
trade volumes improved.