HSBC 2009 Annual Report Download - page 109
Download and view the complete annual report
Please find page 109 of the 2009 HSBC annual report below. You can navigate through the pages in the report by either clicking on the pages listed below, or by using the keyword search tool below to find specific information within the annual report.-
 1
1 -
2
-
3
-
4
-
5
-
6
-
7
-
8
-
9
-
10
-
11
-
12
-
13
-
14
-
15
-
16
-
17
-
18
-
19
-
20
-
21
-
22
-
23
-
24
-
25
-
26
-
27
-
28
-
29
-
30
-
31
-
32
-
33
-
34
-
35
-
36
-
37
-
38
-
39
-
40
-
41
-
42
-
43
-
44
-
45
-
46
-
47
-
48
-
49
-
50
-
51
-
52
-
53
-
54
-
55
-
56
-
57
-
58
-
59
-
60
-
61
-
62
-
63
-
64
-
65
-
66
-
67
-
68
-
69
-
70
-
71
-
72
-
73
-
74
-
75
-
76
-
77
-
78
-
79
-
80
-
81
-
82
-
83
-
84
-
85
-
86
-
87
-
88
-
89
-
90
-
91
-
92
-
93
-
94
-
95
-
96
-
97
-
98
-
 99
99 -
 100
100 -
 101
101 -
 102
102 -
 103
103 -
 104
104 -
 105
105 -
 106
106 -
 107
107 -
 108
108 -
 109
109 -
 110
110 -
 111
111 -
 112
112 -
 113
113 -
 114
114 -
 115
115 -
 116
116 -
 117
117 -
 118
118 -
 119
119 -
120
-
121
-
122
-
123
-
124
-
125
-
126
-
127
-
128
-
129
-
130
-
131
-
132
-
133
-
134
-
135
-
136
-
137
-
138
-
139
-
140
-
141
-
142
-
143
-
144
-
145
-
146
-
147
-
148
-
149
-
150
-
151
-
152
-
153
-
154
-
155
-
156
-
157
-
158
-
159
-
160
-
161
-
162
-
163
-
164
-
165
-
166
-
167
-
168
-
169
-
170
-
171
-
172
-
173
-
174
-
175
-
176
-
177
-
178
-
179
-
180
-
181
-
182
-
183
-
184
-
185
-
186
-
187
-
188
-
189
-
190
-
191
-
192
-
193
-
194
-
195
-
196
-
197
-
198
-
199
-
200
-
201
-
202
-
203
-
204
-
205
-
206
-
207
-
208
-
209
-
210
-
211
-
212
-
213
-
214
-
215
-
216
-
217
-
218
-
219
-
220
-
221
-
222
-
223
-
224
-
225
-
226
-
227
-
228
-
229
-
230
-
231
-
232
-
233
-
234
-
235
-
236
-
237
-
238
-
239
-
240
-
241
-
242
-
243
-
244
-
245
-
246
-
247
-
248
-
249
-
250
-
251
-
252
-
253
-
254
-
255
-
256
-
257
-
258
-
259
-
260
-
261
-
262
-
263
-
264
-
265
-
266
-
267
-
268
-
269
-
270
-
271
-
272
-
273
-
274
-
275
-
276
-
277
-
278
-
279
-
280
-
281
-
282
-
283
-
284
-
285
-
286
-
287
-
288
-
289
-
290
-
291
-
292
-
293
-
294
-
295
-
296
-
297
-
298
-
299
-
300
-
301
-
302
-
303
-
304
-
305
-
306
-
307
-
308
-
309
-
310
-
311
-
312
-
313
-
314
-
315
-
316
-
317
-
318
-
319
-
320
-
321
-
322
-
323
-
324
-
325
-
326
-
327
-
328
-
329
-
330
-
331
-
332
-
333
-
334
-
335
-
336
-
337
-
338
-
339
-
340
-
341
-
342
-
343
-
344
-
345
-
346
-
347
-
348
-
349
-
350
-
351
-
352
-
353
-
354
-
355
-
356
-
357
-
358
-
359
-
360
-
361
-
362
-
363
-
364
-
365
-
366
-
367
-
368
-
369
-
370
-
371
-
372
-
373
-
374
-
375
-
376
-
377
-
378
-
379
-
380
-
381
-
382
-
383
-
384
-
385
-
386
-
387
-
388
-
389
-
390
-
391
-
392
-
393
-
394
-
395
-
396
-
397
-
398
-
399
-
400
-
401
-
402
-
403
-
404
-
405
-
406
-
407
-
408
-
409
-
410
-
411
-
412
-
413
-
414
-
415
-
416
-
417
-
418
-
419
-
420
-
421
-
422
-
423
-
424
-
425
-
426
-
427
-
428
-
429
-
430
-
431
-
432
-
433
-
434
-
435
-
436
-
437
-
438
-
439
-
440
-
441
-
442
-
443
-
444
-
445
-
446
-
447
-
448
-
449
-
450
-
451
-
452
-
453
-
454
-
455
-
456
-
457
-
458
-
459
-
460
-
461
-
462
-
463
-
464
-
465
-
466
-
467
-
468
-
469
-
470
-
471
-
472
-
473
-
474
-
475
-
476
-
477
-
478
-
479
-
480
-
481
-
482
-
483
-
484
-
485
-
486
-
487
-
488
-
489
-
490
-
491
-
492
-
493
-
494
-
495
-
496
-
497
-
498
-
499
-
500
-
501
-
502
-
503
-
504
 |
 |

107
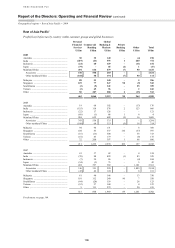
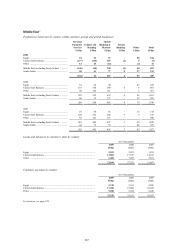
Loans and advances to customers (net) by country
At 31 December
2009
US$m
2008
US$m
2007
US$m
Australia ........................................................................................................... 12,112 9,321 11,339
India ................................................................................................................. 4,893 6,244 7,220
Indonesia .......................................................................................................... 2,721 1,904 1,642
Japan ................................................................................................................ 2,496 5,839 4,258
Mainland China ............................................................................................... 13,294 11,440 11,647
Malaysia ........................................................................................................... 9,132 9,404 8,856
Singapore ......................................................................................................... 14,817 13,441 11,505
South Korea ..................................................................................................... 4,438 5,336 7,124
Taiwan ............................................................................................................. 4,280 4,329 3,658
Other ................................................................................................................ 11,860 13,403 12,996
80,043 80,661 80,245
Customer accounts by country
At 31 December
2009
US$m
2008
US$m
2007
US$m
Australia ........................................................................................................... 12,093 9,201 11,418
India ................................................................................................................. 11,676 9,767 12,021
Indonesia .......................................................................................................... 5,014 2,896 2,574
Japan ................................................................................................................ 4,914 6,204 4,657
Mainland China ............................................................................................... 21,867 19,171 14,537
Malaysia ........................................................................................................... 12,809 11,963 11,701
Singapore ......................................................................................................... 33,211 32,748 28,962
South Korea ..................................................................................................... 4,162 4,383 5,760
Taiwan ............................................................................................................. 9,891 9,689 9,426
Other ................................................................................................................ 18,362 18,172 18,240
133,999 124,194 119,296
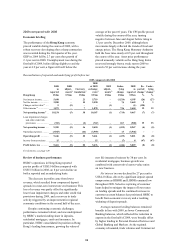
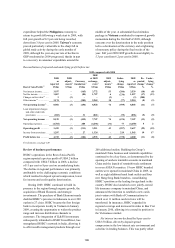
2009 compared with 2008
Economic briefing
Growth in mainland China accelerated throughout
the course of the year as the government’s fiscal
stimulus package helped offset weak levels of
demand within key export markets. Overall GDP
growth totalled 8.7 per cent in 2009, down from
9.6 per cent in 2008, although on a quarterly basis
the annual rate of growth rose to a very high 10.7 per
cent in the final three months of the year. Industrial
production also gathered momentum as the year
progressed, while very strong levels of bank lending
growth helped fixed asset investment expenditure to
maintain a rapid pace of expansion throughout 2009.
Consumer spending remained robust, with retail
sales rising by 17.5 per cent in the year. The annual
CPI rate was negative throughout much of 2009,
largely reflecting the earlier movements in food and
energy prices, before accelerating to 1.9 per cent in
December 2009. The renminbi exchange rate was
little changed against the US dollar throughout the
course of the year.
Economic conditions proved difficult in Japan
during 2009, although some signs of stabilisation did
emerge following an extremely weak start to the
year. First quarter GDP fell by 3.2 per cent on a
quarter-on-quarter basis, before gains of 1.3 per cent,
zero and 1.1 per cent were recorded in the next three
quarters, respectively. The unemployment rate rose
from 4.3 per cent in December 2008 to a record high
of 5.7 per cent in July 2009, before declining to
finish the year at 5.1 per cent. The Bank of Japan
introduced a range of initiatives in January 2009
with the intention of improving financing conditions
across the corporate sector, while fiscal stimulus
packages were also implemented.
Elsewhere in Asia, most economies experienced
a further year of uneven growth in 2009. Sharp
economic contractions proved commonplace across
the region during the early months of 2009 before
economic recovery began, often helped by an
aggressive loosening of both monetary and fiscal
policy. Such trends were particularly evident in
Singapore where, following a very weak start to
2009, a rapid rate of expansion was recorded during
the second quarter, although GDP growth fell back
into negative territory during the final months of the
year. Growth proved much more stable in India,
with GDP rising by 6.3 per cent in the first three