HSBC 2009 Annual Report Download - page 292
Download and view the complete annual report
Please find page 292 of the 2009 HSBC annual report below. You can navigate through the pages in the report by either clicking on the pages listed below, or by using the keyword search tool below to find specific information within the annual report.-
 1
1 -
2
-
3
-
4
-
5
-
6
-
7
-
8
-
9
-
10
-
11
-
12
-
13
-
14
-
15
-
16
-
17
-
18
-
19
-
20
-
21
-
22
-
23
-
24
-
25
-
26
-
27
-
28
-
29
-
30
-
31
-
32
-
33
-
34
-
35
-
36
-
37
-
38
-
39
-
40
-
41
-
42
-
43
-
44
-
45
-
46
-
47
-
48
-
49
-
50
-
51
-
52
-
53
-
54
-
55
-
56
-
57
-
58
-
59
-
60
-
61
-
62
-
63
-
64
-
65
-
66
-
67
-
68
-
69
-
70
-
71
-
72
-
73
-
74
-
75
-
76
-
77
-
78
-
79
-
80
-
81
-
82
-
83
-
84
-
85
-
86
-
87
-
88
-
89
-
90
-
91
-
92
-
93
-
94
-
95
-
96
-
97
-
98
-
99
-
100
-
101
-
102
-
103
-
104
-
105
-
106
-
107
-
108
-
109
-
110
-
111
-
112
-
113
-
114
-
115
-
116
-
117
-
118
-
119
-
120
-
121
-
122
-
123
-
124
-
125
-
126
-
127
-
128
-
129
-
130
-
131
-
132
-
133
-
134
-
135
-
136
-
137
-
138
-
139
-
140
-
141
-
142
-
143
-
144
-
145
-
146
-
147
-
148
-
149
-
150
-
151
-
152
-
153
-
154
-
155
-
156
-
157
-
158
-
159
-
160
-
161
-
162
-
163
-
164
-
165
-
166
-
167
-
168
-
169
-
170
-
171
-
172
-
173
-
174
-
175
-
176
-
177
-
178
-
179
-
180
-
181
-
182
-
183
-
184
-
185
-
186
-
187
-
188
-
189
-
190
-
191
-
192
-
193
-
194
-
195
-
196
-
197
-
198
-
199
-
200
-
201
-
202
-
203
-
204
-
205
-
206
-
207
-
208
-
209
-
210
-
211
-
212
-
213
-
214
-
215
-
216
-
217
-
218
-
219
-
220
-
221
-
222
-
223
-
224
-
225
-
226
-
227
-
228
-
229
-
230
-
231
-
232
-
233
-
234
-
235
-
236
-
237
-
238
-
239
-
240
-
241
-
242
-
243
-
244
-
245
-
246
-
247
-
248
-
249
-
250
-
251
-
252
-
253
-
254
-
255
-
256
-
257
-
258
-
259
-
260
-
261
-
262
-
263
-
264
-
265
-
266
-
267
-
268
-
269
-
270
-
271
-
272
-
273
-
274
-
275
-
276
-
277
-
278
-
279
-
280
-
281
-
 282
282 -
 283
283 -
 284
284 -
 285
285 -
 286
286 -
 287
287 -
 288
288 -
 289
289 -
 290
290 -
 291
291 -
 292
292 -
 293
293 -
 294
294 -
 295
295 -
 296
296 -
 297
297 -
 298
298 -
 299
299 -
 300
300 -
 301
301 -
 302
302 -
303
-
304
-
305
-
306
-
307
-
308
-
309
-
310
-
311
-
312
-
313
-
314
-
315
-
316
-
317
-
318
-
319
-
320
-
321
-
322
-
323
-
324
-
325
-
326
-
327
-
328
-
329
-
330
-
331
-
332
-
333
-
334
-
335
-
336
-
337
-
338
-
339
-
340
-
341
-
342
-
343
-
344
-
345
-
346
-
347
-
348
-
349
-
350
-
351
-
352
-
353
-
354
-
355
-
356
-
357
-
358
-
359
-
360
-
361
-
362
-
363
-
364
-
365
-
366
-
367
-
368
-
369
-
370
-
371
-
372
-
373
-
374
-
375
-
376
-
377
-
378
-
379
-
380
-
381
-
382
-
383
-
384
-
385
-
386
-
387
-
388
-
389
-
390
-
391
-
392
-
393
-
394
-
395
-
396
-
397
-
398
-
399
-
400
-
401
-
402
-
403
-
404
-
405
-
406
-
407
-
408
-
409
-
410
-
411
-
412
-
413
-
414
-
415
-
416
-
417
-
418
-
419
-
420
-
421
-
422
-
423
-
424
-
425
-
426
-
427
-
428
-
429
-
430
-
431
-
432
-
433
-
434
-
435
-
436
-
437
-
438
-
439
-
440
-
441
-
442
-
443
-
444
-
445
-
446
-
447
-
448
-
449
-
450
-
451
-
452
-
453
-
454
-
455
-
456
-
457
-
458
-
459
-
460
-
461
-
462
-
463
-
464
-
465
-
466
-
467
-
468
-
469
-
470
-
471
-
472
-
473
-
474
-
475
-
476
-
477
-
478
-
479
-
480
-
481
-
482
-
483
-
484
-
485
-
486
-
487
-
488
-
489
-
490
-
491
-
492
-
493
-
494
-
495
-
496
-
497
-
498
-
499
-
500
-
501
-
502
-
503
-
504
 |
 |

HSBC HOLDINGS PLC
Report of the Directors: Risk (continued)
Capital management and allocation > Capital structure / Movement in tier 1 capital and RWAs // Subsidiaries’ RWAs // Footnotes
290
2009 2008
% %
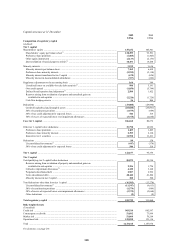
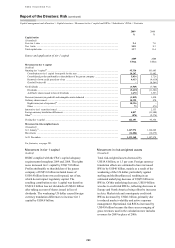
Capital ratios
(Unaudited)
Core tier 1 ratio ..................................................................................................................................... 9.4 7.0
Tier 1 ratio ............................................................................................................................................ 10.8 8.3
Total capital ratio .................................................................................................................................. 13.7 11.4
Source and application of tier 1 capital
2009
US$m
2008
US$m
Movement in tier 1 capital
(Audited)
Opening tier 1 capital79 .......................................................................................................................... 95,336 101,685
Contribution to tier 1 capital from profit for the year ...................................................................... 10,247 11,682
Consolidated profits attributable to shareholders of the parent company ....................................... 5,834 5,728
Removal of own credit spread net of tax ......................................................................................... 4,413 (4,610)
Goodwill write-offs .......................................................................................................................... – 10,564
Net dividends ........................................................................................................................................ (3,969) (7,708)
Dividends .......................................................................................................................................... (5,639) (11,301)
Add back: shares issued in lieu of dividends ................................................................................... 1,670 3,593
Decrease/(increase) in goodwill and intangible assets deducted ......................................................... (1,819) 1,430
Ordinary shares issued .......................................................................................................................... 18,399 470
Rights issue (net of expenses)80 ....................................................................................................... 18,326 –
Other ................................................................................................................................................. 73 470
Innovative tier 1 securities issued ........................................................................................................ – 2,133
Foreign currency translation differences .............................................................................................. 4,837 (11,980)
Other79 ................................................................................................................................................... (874) (2,376)
Closing tier 1 capital ............................................................................................................................. 122,157 95,336
Movement in risk-weighted assets
(Unaudited)
At 1 January79 ........................................................................................................................................ 1,147,974 1,164,649
Movements ........................................................................................................................................... (14,806) (16,675)
At 31 December .................................................................................................................................... 1,133,168 1,147,974
For footnotes, see page 291.
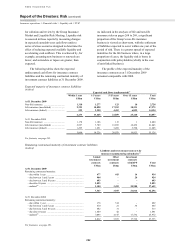
Movement in tier 1 capital
(Audited)
HSBC complied with the FSA’s capital adequacy
requirements throughout 2009 and 2008. The rights
issue increased tier 1 capital by US$17.8 billion.
Profits attributable to shareholders of the parent
company of US$5.8 billion included losses of
US$4.4 billion from own credit spread, net of tax,
which do not impact regulatory capital. The
resulting contribution to tier 1 capital was therefore
US$10.2 billion less net dividends of US$4.0 billion
after taking account of shares issued in lieu of
dividends. The weakening US dollar caused foreign
currency translation differences to increase tier 1
capital by US$4.8 billion.
Movement in risk-weighted assets
(Unaudited)
Total risk-weighted assets decreased by
US$14.8 billion, or 1.3 per cent. Foreign currency
translation effects are estimated to have increased
RWAs by US$40 billion, mainly as a result of the
weakening of the US dollar, particularly against
sterling and the Brazilian real, resulting in an
estimated underlying decrease of US$55 billion in
RWAs. Of this underlying decrease, US$19 billion
was due to credit risk RWAs, reflecting decreases in
Europe and North America being offset by increases
in Asia. Market risk and counterparty credit risk
RWAs decreased by US$41 billion, primarily due
to reduced market volatility and active exposure
management. Operational risk RWAs increased by
US$4.8 billion because the three-year averaging of
gross revenues used in the calculation now includes
revenues for 2009 in place of 2006.