HSBC 2009 Annual Report Download - page 114
Download and view the complete annual report
Please find page 114 of the 2009 HSBC annual report below. You can navigate through the pages in the report by either clicking on the pages listed below, or by using the keyword search tool below to find specific information within the annual report.-
 1
1 -
2
-
3
-
4
-
5
-
6
-
7
-
8
-
9
-
10
-
11
-
12
-
13
-
14
-
15
-
16
-
17
-
18
-
19
-
20
-
21
-
22
-
23
-
24
-
25
-
26
-
27
-
28
-
29
-
30
-
31
-
32
-
33
-
34
-
35
-
36
-
37
-
38
-
39
-
40
-
41
-
42
-
43
-
44
-
45
-
46
-
47
-
48
-
49
-
50
-
51
-
52
-
53
-
54
-
55
-
56
-
57
-
58
-
59
-
60
-
61
-
62
-
63
-
64
-
65
-
66
-
67
-
68
-
69
-
70
-
71
-
72
-
73
-
74
-
75
-
76
-
77
-
78
-
79
-
80
-
81
-
82
-
83
-
84
-
85
-
86
-
87
-
88
-
89
-
90
-
91
-
92
-
93
-
94
-
95
-
96
-
97
-
98
-
99
-
100
-
101
-
102
-
103
-
 104
104 -
 105
105 -
 106
106 -
 107
107 -
 108
108 -
 109
109 -
 110
110 -
 111
111 -
 112
112 -
 113
113 -
 114
114 -
 115
115 -
 116
116 -
 117
117 -
 118
118 -
 119
119 -
 120
120 -
 121
121 -
 122
122 -
 123
123 -
 124
124 -
125
-
126
-
127
-
128
-
129
-
130
-
131
-
132
-
133
-
134
-
135
-
136
-
137
-
138
-
139
-
140
-
141
-
142
-
143
-
144
-
145
-
146
-
147
-
148
-
149
-
150
-
151
-
152
-
153
-
154
-
155
-
156
-
157
-
158
-
159
-
160
-
161
-
162
-
163
-
164
-
165
-
166
-
167
-
168
-
169
-
170
-
171
-
172
-
173
-
174
-
175
-
176
-
177
-
178
-
179
-
180
-
181
-
182
-
183
-
184
-
185
-
186
-
187
-
188
-
189
-
190
-
191
-
192
-
193
-
194
-
195
-
196
-
197
-
198
-
199
-
200
-
201
-
202
-
203
-
204
-
205
-
206
-
207
-
208
-
209
-
210
-
211
-
212
-
213
-
214
-
215
-
216
-
217
-
218
-
219
-
220
-
221
-
222
-
223
-
224
-
225
-
226
-
227
-
228
-
229
-
230
-
231
-
232
-
233
-
234
-
235
-
236
-
237
-
238
-
239
-
240
-
241
-
242
-
243
-
244
-
245
-
246
-
247
-
248
-
249
-
250
-
251
-
252
-
253
-
254
-
255
-
256
-
257
-
258
-
259
-
260
-
261
-
262
-
263
-
264
-
265
-
266
-
267
-
268
-
269
-
270
-
271
-
272
-
273
-
274
-
275
-
276
-
277
-
278
-
279
-
280
-
281
-
282
-
283
-
284
-
285
-
286
-
287
-
288
-
289
-
290
-
291
-
292
-
293
-
294
-
295
-
296
-
297
-
298
-
299
-
300
-
301
-
302
-
303
-
304
-
305
-
306
-
307
-
308
-
309
-
310
-
311
-
312
-
313
-
314
-
315
-
316
-
317
-
318
-
319
-
320
-
321
-
322
-
323
-
324
-
325
-
326
-
327
-
328
-
329
-
330
-
331
-
332
-
333
-
334
-
335
-
336
-
337
-
338
-
339
-
340
-
341
-
342
-
343
-
344
-
345
-
346
-
347
-
348
-
349
-
350
-
351
-
352
-
353
-
354
-
355
-
356
-
357
-
358
-
359
-
360
-
361
-
362
-
363
-
364
-
365
-
366
-
367
-
368
-
369
-
370
-
371
-
372
-
373
-
374
-
375
-
376
-
377
-
378
-
379
-
380
-
381
-
382
-
383
-
384
-
385
-
386
-
387
-
388
-
389
-
390
-
391
-
392
-
393
-
394
-
395
-
396
-
397
-
398
-
399
-
400
-
401
-
402
-
403
-
404
-
405
-
406
-
407
-
408
-
409
-
410
-
411
-
412
-
413
-
414
-
415
-
416
-
417
-
418
-
419
-
420
-
421
-
422
-
423
-
424
-
425
-
426
-
427
-
428
-
429
-
430
-
431
-
432
-
433
-
434
-
435
-
436
-
437
-
438
-
439
-
440
-
441
-
442
-
443
-
444
-
445
-
446
-
447
-
448
-
449
-
450
-
451
-
452
-
453
-
454
-
455
-
456
-
457
-
458
-
459
-
460
-
461
-
462
-
463
-
464
-
465
-
466
-
467
-
468
-
469
-
470
-
471
-
472
-
473
-
474
-
475
-
476
-
477
-
478
-
479
-
480
-
481
-
482
-
483
-
484
-
485
-
486
-
487
-
488
-
489
-
490
-
491
-
492
-
493
-
494
-
495
-
496
-
497
-
498
-
499
-
500
-
501
-
502
-
503
-
504
 |
 |

HSBC HOLDINGS PLC
Report of the Directors: Operating and Financial Review (continued)
Geographical regions > Rest of Asia-Pacific > 2008
112
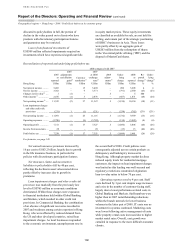
cent on a year-on-year basis. Rising food prices
proved particularly problematic for the Philippines
during the first half of the year as inflation moved
well above the central bank’s targeted range,
although the earlier tightening of monetary policy
was partially reversed at the end of 2008. Growth
slowed sharply in Taiwan during the course of the
year, driven by deteriorating conditions overseas.
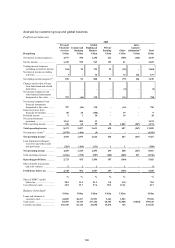
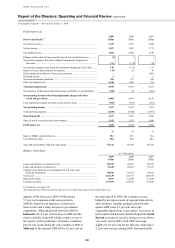
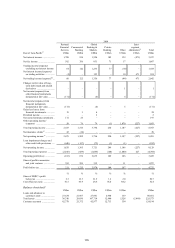
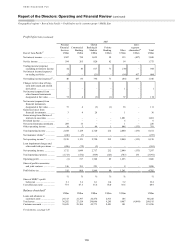
Reconciliation of reported and underlying profit before tax
2008 compared with 2007
Rest of Asia-Pacific27
2007
as
reported
US$m
2007
adjustments
and dilution
gains10
US$m
Currency
translation11
US$m
2007
at 2008
exchange
rates17
US$m
2008
adjust-
ments10
US$m
Under-
lying
change
US$m
2008
as
reported
US$m
Re-
ported
change13
%
Under-
lying
change13
%
Net interest income .......... 3,049 – 38 3,087 31 819 3,937 29 27
Net fee income ................. 1,775 – 22 1,797 3 67 1,867 5 4
Changes in fair value14 .... – – – – 3 – 3
Other income15 ................. 3,334 (1,081) 15 2,268 70 836 3,174 (5) 37
Net operating income16 .... 8,158 (1,081) 75 7,152 107 1,722 8,981 10 24
Loan impairment charges
and other credit risk
provisions .................... (561) – 15 (546) – (306) (852) (52) (56)
Net operating income ...... 7,597 (1,081) 90 6,606 107 1,416 8,129 7 21
Operating expenses .......... (3,991) – (12) (4,003) (110) (591) (4,704) (18) (15)
Operating profit ............... 3,606 (1,081) 78 2,603 (3) 825 3,425 (5) 32
Income from associates ... 1,096 – 93 1,189 – 108 1,297 18 9
Profit before tax ............... 4,702 (1,081) 171 3,792 (3) 933 4,722 – 25
For footnotes, see page 149.
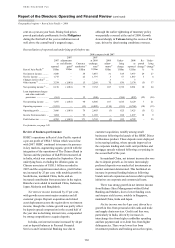
Review of business performance
HSBC’s operations in Rest of Asia-Pacific reported
a pre-tax profit of US$4.7 billion which was in line
with 2007. HSBC continued to increase its presence
in key markets, augmenting organic growth with the
integration of the operations of The Chinese Bank in
Taiwan and the purchase of IL&FS Investsmart Ltd
in India, which was completed in September. On an
underlying basis, excluding the dilution gains on
Chinese associates of US$1.1 billion recorded in
2007 and the acquisitions noted above, profit before
tax increased by 25 per cent, with notable growth in
South Korea, mainland China, India, and an
increased contribution from associates in the region.
Branches were added in mainland China, Indonesia,
Japan, Malaysia and Bangladesh.
Net interest income increased by 27 per cent,
with growth across most major countries and all
customer groups. Deposit acquisition and related
asset deployment across the region drove net interest
income, though this volume growth was partly offset
by deposit spread compression in the second half of
the year due to declining interest rates, compounded
by strong competition to acquire deposits.
In India, net interest income increased by 44 per
cent as deposit balances in Personal Financial
Services and Commercial Banking rose due to
customer acquisition, notably among small
businesses following the launch of the HSBC Direct
for Business product. These deposits were deployed
in increasing lending, where spreads improved on
the corporate lending and credit card portfolios and
mortgage spreads widened following a re-pricing in
the second half of the year.
In mainland China, net interest income also rose
due to deposit growth, as investors increasingly
preferred deposits over market-led investments as
market sentiment deteriorated. This facilitated an
increase in personal lending balances following
branch network expansion and successful re-pricing
initiatives on corporate and commercial loans.
There was strong growth in net interest income
from Balance Sheet Management within Global
Banking and Markets, due to lower funding costs
and steeper yield curves, notably in Singapore,
mainland China, India and Japan.
Net fee income rose by 4 per cent, driven by a
growth in fees from personal credit cards and trade
and supply chain services. Credit card fees rose,
particularly in India, driven by increases in
interchange fees from higher cardholder spending
and late payment and over-limit fees from higher
delinquencies. There were lower fees from
investment products and broking across the region,