HSBC 2009 Annual Report Download - page 133
Download and view the complete annual report
Please find page 133 of the 2009 HSBC annual report below. You can navigate through the pages in the report by either clicking on the pages listed below, or by using the keyword search tool below to find specific information within the annual report.-
 1
1 -
2
-
3
-
4
-
5
-
6
-
7
-
8
-
9
-
10
-
11
-
12
-
13
-
14
-
15
-
16
-
17
-
18
-
19
-
20
-
21
-
22
-
23
-
24
-
25
-
26
-
27
-
28
-
29
-
30
-
31
-
32
-
33
-
34
-
35
-
36
-
37
-
38
-
39
-
40
-
41
-
42
-
43
-
44
-
45
-
46
-
47
-
48
-
49
-
50
-
51
-
52
-
53
-
54
-
55
-
56
-
57
-
58
-
59
-
60
-
61
-
62
-
63
-
64
-
65
-
66
-
67
-
68
-
69
-
70
-
71
-
72
-
73
-
74
-
75
-
76
-
77
-
78
-
79
-
80
-
81
-
82
-
83
-
84
-
85
-
86
-
87
-
88
-
89
-
90
-
91
-
92
-
93
-
94
-
95
-
96
-
97
-
98
-
99
-
100
-
101
-
102
-
103
-
104
-
105
-
106
-
107
-
108
-
109
-
110
-
111
-
112
-
113
-
114
-
115
-
116
-
117
-
118
-
119
-
120
-
121
-
122
-
 123
123 -
 124
124 -
 125
125 -
 126
126 -
 127
127 -
 128
128 -
 129
129 -
 130
130 -
 131
131 -
 132
132 -
 133
133 -
 134
134 -
 135
135 -
 136
136 -
 137
137 -
 138
138 -
 139
139 -
 140
140 -
 141
141 -
 142
142 -
 143
143 -
144
-
145
-
146
-
147
-
148
-
149
-
150
-
151
-
152
-
153
-
154
-
155
-
156
-
157
-
158
-
159
-
160
-
161
-
162
-
163
-
164
-
165
-
166
-
167
-
168
-
169
-
170
-
171
-
172
-
173
-
174
-
175
-
176
-
177
-
178
-
179
-
180
-
181
-
182
-
183
-
184
-
185
-
186
-
187
-
188
-
189
-
190
-
191
-
192
-
193
-
194
-
195
-
196
-
197
-
198
-
199
-
200
-
201
-
202
-
203
-
204
-
205
-
206
-
207
-
208
-
209
-
210
-
211
-
212
-
213
-
214
-
215
-
216
-
217
-
218
-
219
-
220
-
221
-
222
-
223
-
224
-
225
-
226
-
227
-
228
-
229
-
230
-
231
-
232
-
233
-
234
-
235
-
236
-
237
-
238
-
239
-
240
-
241
-
242
-
243
-
244
-
245
-
246
-
247
-
248
-
249
-
250
-
251
-
252
-
253
-
254
-
255
-
256
-
257
-
258
-
259
-
260
-
261
-
262
-
263
-
264
-
265
-
266
-
267
-
268
-
269
-
270
-
271
-
272
-
273
-
274
-
275
-
276
-
277
-
278
-
279
-
280
-
281
-
282
-
283
-
284
-
285
-
286
-
287
-
288
-
289
-
290
-
291
-
292
-
293
-
294
-
295
-
296
-
297
-
298
-
299
-
300
-
301
-
302
-
303
-
304
-
305
-
306
-
307
-
308
-
309
-
310
-
311
-
312
-
313
-
314
-
315
-
316
-
317
-
318
-
319
-
320
-
321
-
322
-
323
-
324
-
325
-
326
-
327
-
328
-
329
-
330
-
331
-
332
-
333
-
334
-
335
-
336
-
337
-
338
-
339
-
340
-
341
-
342
-
343
-
344
-
345
-
346
-
347
-
348
-
349
-
350
-
351
-
352
-
353
-
354
-
355
-
356
-
357
-
358
-
359
-
360
-
361
-
362
-
363
-
364
-
365
-
366
-
367
-
368
-
369
-
370
-
371
-
372
-
373
-
374
-
375
-
376
-
377
-
378
-
379
-
380
-
381
-
382
-
383
-
384
-
385
-
386
-
387
-
388
-
389
-
390
-
391
-
392
-
393
-
394
-
395
-
396
-
397
-
398
-
399
-
400
-
401
-
402
-
403
-
404
-
405
-
406
-
407
-
408
-
409
-
410
-
411
-
412
-
413
-
414
-
415
-
416
-
417
-
418
-
419
-
420
-
421
-
422
-
423
-
424
-
425
-
426
-
427
-
428
-
429
-
430
-
431
-
432
-
433
-
434
-
435
-
436
-
437
-
438
-
439
-
440
-
441
-
442
-
443
-
444
-
445
-
446
-
447
-
448
-
449
-
450
-
451
-
452
-
453
-
454
-
455
-
456
-
457
-
458
-
459
-
460
-
461
-
462
-
463
-
464
-
465
-
466
-
467
-
468
-
469
-
470
-
471
-
472
-
473
-
474
-
475
-
476
-
477
-
478
-
479
-
480
-
481
-
482
-
483
-
484
-
485
-
486
-
487
-
488
-
489
-
490
-
491
-
492
-
493
-
494
-
495
-
496
-
497
-
498
-
499
-
500
-
501
-
502
-
503
-
504
 |
 |
131
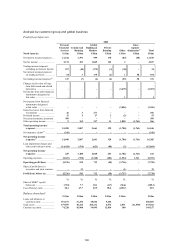
Review of business performance
HSBC’s operations in North America reported a pre-
tax loss of US$15.5 billion in 2008, compared with a
pre-tax profit of US$91 million in 2007. On an
underlying basis, the loss before tax was
US$17.3 billion worse at US$19.0 billion.
Net interest income in North America increased
by 2 per cent to US$15.2 billion, driven by Balance
Sheet Management activities in Global Banking and
Markets which more than offset the decline in
Personal Financial Services as lending reduced.
The significant increase in net interest income
in the Balance Sheet Management business resulted
from correct positioning in anticipation of lower
interest rates. Net interest income was also boosted
by higher balances within certain loan portfolios in
Global Banking and Markets.
Net interest income fell in Personal Financial
Services as asset balances declined and deposit
spreads narrowed. Deposit spread compression was
driven by the competitive environment for retail
deposits in which HSBC refrained from passing on
the full effects of interest rate cuts to customers.
Asset spreads widened, particularly in vehicle
finance and credit cards and, to a lesser extent, the
real estate secured portfolios as yields declined by
less than funding costs in the lower interest rate
environment, and the credit card portfolio benefited
from APR floors. This was partly offset by a rise in
non-performing loans, lower loan prepayments,
increased volumes of loan modifications, and lower
fees from reduced loan origination volumes.
Funding costs declined as a result of lower base
rates during the year.
Lending balances declined as the mortgage
services portfolio continued to run-off, originations
ceased during the year within the dealer and direct-
to-consumer channels in vehicle finance, and tighter
underwriting criteria in consumer lending
constrained customer eligibility for finance. In
addition, US$8.2 billion of mortgages were sold
from the US real estate secured portfolios during the
year. These factors were partly offset by a change in
mix towards higher-yielding credit card loans and
reduced levels of prepayments that resulted in loans
remaining on the balance sheet longer. At the end of
February 2009, HSBC authorised the discontinuation
as soon as practicable of all new receivable
originations of all products by the branch-based
consumer lending business of HSBC Finance in
North America (see page 215).
Net fee income declined by 8 per cent, driven by
reductions in US credit card fees following changes
in fee practices implemented since the fourth quarter
of 2007 and lower cash advance and interchange fees
as a result of reduced volumes. Partly offsetting the
decline were increased income from enhancement
services due to higher customer acceptance rates of
Account Secure Plus and Identity Protection Plan,
a rise in syndication, credit and service fees in
Commercial Banking and increased fees from asset
management.
Trading losses were dominated by write-downs
in Global Banking and Markets on legacy exposures
as continuing turmoil in credit markets adversely
affected valuations of credit and structured credit
trading positions, monoline exposures and leveraged
and acquisition finance loans. Continued
deterioration in the fair value of the run-off portfolio
of sub-prime residential mortgage loans held for sale
also contributed to the loss. US$3.6 billion in
leveraged loans, high yield notes and securities held
for balance sheet management were reclassified in
2008 under revised IFRS rules from trading assets
to loans and receivables and available for sale,
preventing any further mark-to-market trading losses
on these assets. If these reclassifications had not
been made, the loss before tax would have been
US$0.9 billion higher.
The losses on legacy assets were partly offset
by strong performances in other trading areas as
foreign exchange trading benefited from pronounced
market volatility, Rates trading correctly anticipated
central bank rate cuts and gains were generated on
credit default swaps in Global Banking. Revenues
from emerging markets trading and precious metals
trading also rose as a result of ongoing market
volatility and increased transaction volumes as
prices of gold and platinum rose during 2008.
Losses on non-qualifying hedge positions in interest
rate swaps generated further trading losses. In 2007,
the Decision One business, which was closed that
year, recorded trading losses of US$263 million.
Net income from financial instruments
designated at fair value rose by US$304 million to
US$293 million due to income from ineffective
hedges related to long-term debt issued by the
Group’s subsidiaries in North America.
Gains less losses from financial investments
declined, mainly due to losses on US government
agency securities in 2008 and the non-recurrence of
the sale of MasterCard shares, partly offset by gains
from the Visa IPO in 2008.
Net earned insurance premiums decreased by
13 per cent to US$390 million, driven by lower
credit related premiums in HSBC Finance due to
declining loan volumes.