HSBC 2009 Annual Report Download - page 29
Download and view the complete annual report
Please find page 29 of the 2009 HSBC annual report below. You can navigate through the pages in the report by either clicking on the pages listed below, or by using the keyword search tool below to find specific information within the annual report.-
 1
1 -
2
-
3
-
4
-
5
-
6
-
7
-
8
-
9
-
10
-
11
-
12
-
13
-
14
-
15
-
16
-
17
-
18
-
 19
19 -
 20
20 -
 21
21 -
 22
22 -
 23
23 -
 24
24 -
 25
25 -
 26
26 -
 27
27 -
 28
28 -
 29
29 -
 30
30 -
 31
31 -
 32
32 -
 33
33 -
 34
34 -
 35
35 -
 36
36 -
 37
37 -
 38
38 -
 39
39 -
40
-
41
-
42
-
43
-
44
-
45
-
46
-
47
-
48
-
49
-
50
-
51
-
52
-
53
-
54
-
55
-
56
-
57
-
58
-
59
-
60
-
61
-
62
-
63
-
64
-
65
-
66
-
67
-
68
-
69
-
70
-
71
-
72
-
73
-
74
-
75
-
76
-
77
-
78
-
79
-
80
-
81
-
82
-
83
-
84
-
85
-
86
-
87
-
88
-
89
-
90
-
91
-
92
-
93
-
94
-
95
-
96
-
97
-
98
-
99
-
100
-
101
-
102
-
103
-
104
-
105
-
106
-
107
-
108
-
109
-
110
-
111
-
112
-
113
-
114
-
115
-
116
-
117
-
118
-
119
-
120
-
121
-
122
-
123
-
124
-
125
-
126
-
127
-
128
-
129
-
130
-
131
-
132
-
133
-
134
-
135
-
136
-
137
-
138
-
139
-
140
-
141
-
142
-
143
-
144
-
145
-
146
-
147
-
148
-
149
-
150
-
151
-
152
-
153
-
154
-
155
-
156
-
157
-
158
-
159
-
160
-
161
-
162
-
163
-
164
-
165
-
166
-
167
-
168
-
169
-
170
-
171
-
172
-
173
-
174
-
175
-
176
-
177
-
178
-
179
-
180
-
181
-
182
-
183
-
184
-
185
-
186
-
187
-
188
-
189
-
190
-
191
-
192
-
193
-
194
-
195
-
196
-
197
-
198
-
199
-
200
-
201
-
202
-
203
-
204
-
205
-
206
-
207
-
208
-
209
-
210
-
211
-
212
-
213
-
214
-
215
-
216
-
217
-
218
-
219
-
220
-
221
-
222
-
223
-
224
-
225
-
226
-
227
-
228
-
229
-
230
-
231
-
232
-
233
-
234
-
235
-
236
-
237
-
238
-
239
-
240
-
241
-
242
-
243
-
244
-
245
-
246
-
247
-
248
-
249
-
250
-
251
-
252
-
253
-
254
-
255
-
256
-
257
-
258
-
259
-
260
-
261
-
262
-
263
-
264
-
265
-
266
-
267
-
268
-
269
-
270
-
271
-
272
-
273
-
274
-
275
-
276
-
277
-
278
-
279
-
280
-
281
-
282
-
283
-
284
-
285
-
286
-
287
-
288
-
289
-
290
-
291
-
292
-
293
-
294
-
295
-
296
-
297
-
298
-
299
-
300
-
301
-
302
-
303
-
304
-
305
-
306
-
307
-
308
-
309
-
310
-
311
-
312
-
313
-
314
-
315
-
316
-
317
-
318
-
319
-
320
-
321
-
322
-
323
-
324
-
325
-
326
-
327
-
328
-
329
-
330
-
331
-
332
-
333
-
334
-
335
-
336
-
337
-
338
-
339
-
340
-
341
-
342
-
343
-
344
-
345
-
346
-
347
-
348
-
349
-
350
-
351
-
352
-
353
-
354
-
355
-
356
-
357
-
358
-
359
-
360
-
361
-
362
-
363
-
364
-
365
-
366
-
367
-
368
-
369
-
370
-
371
-
372
-
373
-
374
-
375
-
376
-
377
-
378
-
379
-
380
-
381
-
382
-
383
-
384
-
385
-
386
-
387
-
388
-
389
-
390
-
391
-
392
-
393
-
394
-
395
-
396
-
397
-
398
-
399
-
400
-
401
-
402
-
403
-
404
-
405
-
406
-
407
-
408
-
409
-
410
-
411
-
412
-
413
-
414
-
415
-
416
-
417
-
418
-
419
-
420
-
421
-
422
-
423
-
424
-
425
-
426
-
427
-
428
-
429
-
430
-
431
-
432
-
433
-
434
-
435
-
436
-
437
-
438
-
439
-
440
-
441
-
442
-
443
-
444
-
445
-
446
-
447
-
448
-
449
-
450
-
451
-
452
-
453
-
454
-
455
-
456
-
457
-
458
-
459
-
460
-
461
-
462
-
463
-
464
-
465
-
466
-
467
-
468
-
469
-
470
-
471
-
472
-
473
-
474
-
475
-
476
-
477
-
478
-
479
-
480
-
481
-
482
-
483
-
484
-
485
-
486
-
487
-
488
-
489
-
490
-
491
-
492
-
493
-
494
-
495
-
496
-
497
-
498
-
499
-
500
-
501
-
502
-
503
-
504
 |
 |

27
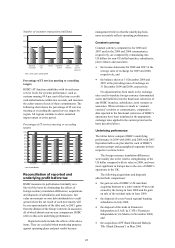
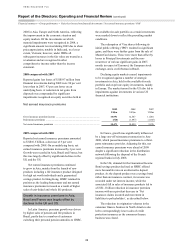
accounts as they positioned for rising interest rates or
prospective investment opportunities.
Competition for deposits and exceptionally
low interest rates squeezed deposit margins.
The net interest spread rose slightly. As a result
of continuing deposit inflows, the Group sourced an
increasing proportion of its funding from customer
accounts, and consequently reduced its reliance on
relatively more expensive debt securities. The
benefit of this was largely offset, however, by a
decline in customer lending, particularly higher
yielding personal lending, which reduced the
average yield on assets.
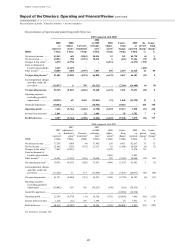
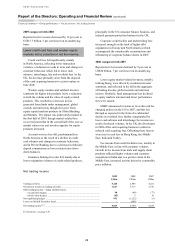
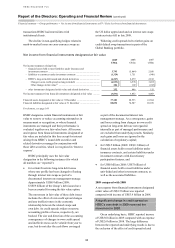
2008 compared with 2007
Reported net interest income of US$42.6 billion rose
by 13 per cent compared with 2007, 13 per cent on
an underlying basis.
Growth in net interest income was driven by
significantly higher revenues in Balance Sheet
Management, in part reflecting favourable
positioning to take advantage of falling interest rates.
Lending and deposit balances also grew strongly,
while progressive reductions in central bank
reference rates led to a decline in both asset yields
and the cost of funds. Overall, spreads narrowed on
an underlying basis.
Average interest-earning assets increased to
US$1,467 billion, led by growth in average loans
and advances to customers. This was mainly due to
an increase in average term lending balances in
Europe and Asia.
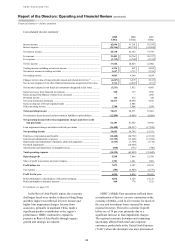
An increase in average interest-bearing
liabilities was driven by growth in average customer
accounts, notably in Europe. HSBC attracted
substantial deposits from customers who valued
HSBC’s perceived strength at a time of global
financial market turmoil and customers also
expressed a preference for security and liquidity
following declines in equity markets.
Interest rates were cut aggressively in many
countries during 2008, as central banks reduced their
reference rates as part of stimulus programmes
introduced in response to deteriorating economic
conditions. This contributed to a decline in asset
yields. The cost of funds also fell, but this was less
significant than the decline in yields as spreads
narrowed overall on an underlying basis.
In North America, net interest income was also
adversely affected by rises in loan modifications
designed to reduce the payment burden on the
Group’s customers, and impaired loans.
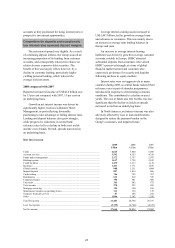
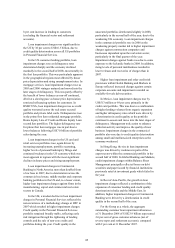
Net fee income
2009
US$m
2008
US$m
2007
US$m
Cards ........................................................................................................................ 4,625 5,844 6,496
Account services ...................................................................................................... 3,592 4,353 4,359
Funds under management ........................................................................................ 2,172 2,757 2,975
Broking income ....................................................................................................... 1,617 1,738 2,012
Credit facilities ........................................................................................................ 1,479 1,313 1,138
Insurance .................................................................................................................. 1,421 1,771 1,836
Global custody ......................................................................................................... 988 1,311 1,404
Imports/exports ........................................................................................................ 897 1,014 866
Underwriting ............................................................................................................ 746 325 367
Remittances ............................................................................................................. 613 610 556
Corporate finance .................................................................................................... 396 381 409
Unit trusts ................................................................................................................ 363 502 875
Trust income ............................................................................................................ 278 325 299
Mortgage servicing .................................................................................................. 124 120 109
Maintenance income on operating leases ................................................................ 111 130 139
Taxpayer financial services ..................................................................................... 87 168 252
Other ........................................................................................................................ 1,894 2,102 2,245
Total fee income ...................................................................................................... 21,403 24,764 26,337
Less: fee expense ..................................................................................................... (3,739) (4,740) (4,335)
Net fee income ......................................................................................................... 17,664 20,024 22,002