HSBC 2009 Annual Report Download - page 26
Download and view the complete annual report
Please find page 26 of the 2009 HSBC annual report below. You can navigate through the pages in the report by either clicking on the pages listed below, or by using the keyword search tool below to find specific information within the annual report.-
 1
1 -
2
-
3
-
4
-
5
-
6
-
7
-
8
-
9
-
10
-
11
-
12
-
13
-
14
-
15
-
 16
16 -
 17
17 -
 18
18 -
 19
19 -
 20
20 -
 21
21 -
 22
22 -
 23
23 -
 24
24 -
 25
25 -
 26
26 -
 27
27 -
 28
28 -
 29
29 -
 30
30 -
 31
31 -
 32
32 -
 33
33 -
 34
34 -
 35
35 -
 36
36 -
37
-
38
-
39
-
40
-
41
-
42
-
43
-
44
-
45
-
46
-
47
-
48
-
49
-
50
-
51
-
52
-
53
-
54
-
55
-
56
-
57
-
58
-
59
-
60
-
61
-
62
-
63
-
64
-
65
-
66
-
67
-
68
-
69
-
70
-
71
-
72
-
73
-
74
-
75
-
76
-
77
-
78
-
79
-
80
-
81
-
82
-
83
-
84
-
85
-
86
-
87
-
88
-
89
-
90
-
91
-
92
-
93
-
94
-
95
-
96
-
97
-
98
-
99
-
100
-
101
-
102
-
103
-
104
-
105
-
106
-
107
-
108
-
109
-
110
-
111
-
112
-
113
-
114
-
115
-
116
-
117
-
118
-
119
-
120
-
121
-
122
-
123
-
124
-
125
-
126
-
127
-
128
-
129
-
130
-
131
-
132
-
133
-
134
-
135
-
136
-
137
-
138
-
139
-
140
-
141
-
142
-
143
-
144
-
145
-
146
-
147
-
148
-
149
-
150
-
151
-
152
-
153
-
154
-
155
-
156
-
157
-
158
-
159
-
160
-
161
-
162
-
163
-
164
-
165
-
166
-
167
-
168
-
169
-
170
-
171
-
172
-
173
-
174
-
175
-
176
-
177
-
178
-
179
-
180
-
181
-
182
-
183
-
184
-
185
-
186
-
187
-
188
-
189
-
190
-
191
-
192
-
193
-
194
-
195
-
196
-
197
-
198
-
199
-
200
-
201
-
202
-
203
-
204
-
205
-
206
-
207
-
208
-
209
-
210
-
211
-
212
-
213
-
214
-
215
-
216
-
217
-
218
-
219
-
220
-
221
-
222
-
223
-
224
-
225
-
226
-
227
-
228
-
229
-
230
-
231
-
232
-
233
-
234
-
235
-
236
-
237
-
238
-
239
-
240
-
241
-
242
-
243
-
244
-
245
-
246
-
247
-
248
-
249
-
250
-
251
-
252
-
253
-
254
-
255
-
256
-
257
-
258
-
259
-
260
-
261
-
262
-
263
-
264
-
265
-
266
-
267
-
268
-
269
-
270
-
271
-
272
-
273
-
274
-
275
-
276
-
277
-
278
-
279
-
280
-
281
-
282
-
283
-
284
-
285
-
286
-
287
-
288
-
289
-
290
-
291
-
292
-
293
-
294
-
295
-
296
-
297
-
298
-
299
-
300
-
301
-
302
-
303
-
304
-
305
-
306
-
307
-
308
-
309
-
310
-
311
-
312
-
313
-
314
-
315
-
316
-
317
-
318
-
319
-
320
-
321
-
322
-
323
-
324
-
325
-
326
-
327
-
328
-
329
-
330
-
331
-
332
-
333
-
334
-
335
-
336
-
337
-
338
-
339
-
340
-
341
-
342
-
343
-
344
-
345
-
346
-
347
-
348
-
349
-
350
-
351
-
352
-
353
-
354
-
355
-
356
-
357
-
358
-
359
-
360
-
361
-
362
-
363
-
364
-
365
-
366
-
367
-
368
-
369
-
370
-
371
-
372
-
373
-
374
-
375
-
376
-
377
-
378
-
379
-
380
-
381
-
382
-
383
-
384
-
385
-
386
-
387
-
388
-
389
-
390
-
391
-
392
-
393
-
394
-
395
-
396
-
397
-
398
-
399
-
400
-
401
-
402
-
403
-
404
-
405
-
406
-
407
-
408
-
409
-
410
-
411
-
412
-
413
-
414
-
415
-
416
-
417
-
418
-
419
-
420
-
421
-
422
-
423
-
424
-
425
-
426
-
427
-
428
-
429
-
430
-
431
-
432
-
433
-
434
-
435
-
436
-
437
-
438
-
439
-
440
-
441
-
442
-
443
-
444
-
445
-
446
-
447
-
448
-
449
-
450
-
451
-
452
-
453
-
454
-
455
-
456
-
457
-
458
-
459
-
460
-
461
-
462
-
463
-
464
-
465
-
466
-
467
-
468
-
469
-
470
-
471
-
472
-
473
-
474
-
475
-
476
-
477
-
478
-
479
-
480
-
481
-
482
-
483
-
484
-
485
-
486
-
487
-
488
-
489
-
490
-
491
-
492
-
493
-
494
-
495
-
496
-
497
-
498
-
499
-
500
-
501
-
502
-
503
-
504
 |
 |

HSBC HOLDINGS PLC
Report of the Directors: Operating and Financial Review (continued)
Financial summary > Income statement
24
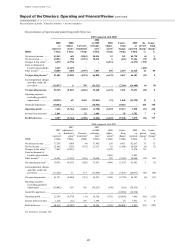
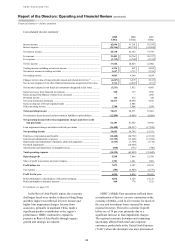
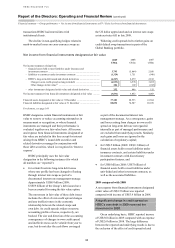
Consolidated income statement
2009
US$m
2008
US$m
2007
US$m
Interest income ........................................................................................................ 62,096 91,301 92,359
Interest expense ....................................................................................................... (21,366) (48,738) (54,564)
Net interest income .................................................................................................. 40,730 42,563 37,795
Fee income ............................................................................................................... 21,403 24,764 26,337
Fee expense .............................................................................................................. (3,739) (4,740) (4,335)
Net fee income ......................................................................................................... 17,664 20,024 22,002
Trading income excluding net interest income ....................................................... 6,236 847 4,458
Net interest income on trading activities ................................................................. 3,627 5,713 5,376
Net trading income .................................................................................................. 9,863 6,560 9,834
Changes in fair value of long-term debt issued and related derivatives18 .............. (6,247) 6,679 2,812
Net income/(expense) from other financial instruments designated at fair value .. 2,716 (2,827) 1,271
Net income/(expense) from financial instruments designated at fair value ........... (3,531) 3,852 4,083
Gains less losses from financial investments .......................................................... 520 197 1,956
Gains arising from dilution of interests in associates ............................................. – – 1,092
Dividend income ...................................................................................................... 126 272 324
Net earned insurance premiums .............................................................................. 10,471 10,850 9,076
Gains on disposal of French regional banks ........................................................... – 2,445 –
Other operating income ........................................................................................... 2,788 1,808 1,439
Total operating income ......................................................................................... 78,631 88,571 87,601
Net insurance claims incurred and movement in liabilities to policyholders ............. (12,450) (6,889) (8,608)
Net operating income before loan impairment charges and other credit
risk provisions ................................................................................................... 66,181 81,682 78,993
Loan impairment charges and other credit risk provisions ..................................... (26,488) (24,937) (17,242)
Net operating income ............................................................................................ 39,693 56,745 61,751
Employee compensation and benefits ..................................................................... (18,468) (20,792) (21,334)
General and administrative expenses ...................................................................... (13,392) (15,260) (15,294)
Depreciation and impairment of property, plant and equipment ............................ (1,725) (1,750) (1,714)
Goodwill impairment ............................................................................................... – (10,564) –
Amortisation and impairment of intangible assets .................................................. (810) (733) (700)
Total operating expenses ....................................................................................... (34,395) (49,099) (39,042)
Operating profit ..................................................................................................... 5,298 7,646 22,709
Share of profit in associates and joint ventures ....................................................... 1,781 1,661 1,503
Profit before tax ..................................................................................................... 7,079 9,307 24,212
Tax expense ............................................................................................................. (385) (2,809) (3,757)
Profit for the year .................................................................................................. 6,694 6,498 20,455
Profit attributable to shareholders of the parent company ...................................... 5,834 5,728 19,133
Profit attributable to minority interests ................................................................... 860 770 1,322
For footnote, see page 149.
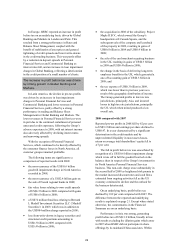
In the Rest of Asia-Pacific region, the economic
challenges faced were similar to those in Hong Kong
and their impact was reflected in lower income and
higher loan impairment charges. Income from
associates, primarily in mainland China, made a
significant positive contribution to the region’s
performance. HSBC continued to expand its
presence in Rest of Asia-Pacific through organic
growth and strategic investment.
HSBC’s Middle East operations suffered from
a combination of factors: a severe contraction in the
economy of Dubai, a fall in oil revenues for much of
the year and investment losses incurred by many
regional investors. This led to a decline in profit
before tax of 74 per cent, primarily due to a
significant increase in loan impairment charges.
The regional economic downturn and continuing
uncertainty affected both retail and corporate
customers, particularly in the United Arab Emirates
(‘UAE’) where the downturn was most pronounced.