HSBC 2009 Annual Report Download - page 39
Download and view the complete annual report
Please find page 39 of the 2009 HSBC annual report below. You can navigate through the pages in the report by either clicking on the pages listed below, or by using the keyword search tool below to find specific information within the annual report.-
 1
1 -
2
-
3
-
4
-
5
-
6
-
7
-
8
-
9
-
10
-
11
-
12
-
13
-
14
-
15
-
16
-
17
-
18
-
19
-
20
-
21
-
22
-
23
-
24
-
25
-
26
-
27
-
28
-
 29
29 -
 30
30 -
 31
31 -
 32
32 -
 33
33 -
 34
34 -
 35
35 -
 36
36 -
 37
37 -
 38
38 -
 39
39 -
 40
40 -
 41
41 -
 42
42 -
 43
43 -
 44
44 -
 45
45 -
 46
46 -
 47
47 -
 48
48 -
 49
49 -
50
-
51
-
52
-
53
-
54
-
55
-
56
-
57
-
58
-
59
-
60
-
61
-
62
-
63
-
64
-
65
-
66
-
67
-
68
-
69
-
70
-
71
-
72
-
73
-
74
-
75
-
76
-
77
-
78
-
79
-
80
-
81
-
82
-
83
-
84
-
85
-
86
-
87
-
88
-
89
-
90
-
91
-
92
-
93
-
94
-
95
-
96
-
97
-
98
-
99
-
100
-
101
-
102
-
103
-
104
-
105
-
106
-
107
-
108
-
109
-
110
-
111
-
112
-
113
-
114
-
115
-
116
-
117
-
118
-
119
-
120
-
121
-
122
-
123
-
124
-
125
-
126
-
127
-
128
-
129
-
130
-
131
-
132
-
133
-
134
-
135
-
136
-
137
-
138
-
139
-
140
-
141
-
142
-
143
-
144
-
145
-
146
-
147
-
148
-
149
-
150
-
151
-
152
-
153
-
154
-
155
-
156
-
157
-
158
-
159
-
160
-
161
-
162
-
163
-
164
-
165
-
166
-
167
-
168
-
169
-
170
-
171
-
172
-
173
-
174
-
175
-
176
-
177
-
178
-
179
-
180
-
181
-
182
-
183
-
184
-
185
-
186
-
187
-
188
-
189
-
190
-
191
-
192
-
193
-
194
-
195
-
196
-
197
-
198
-
199
-
200
-
201
-
202
-
203
-
204
-
205
-
206
-
207
-
208
-
209
-
210
-
211
-
212
-
213
-
214
-
215
-
216
-
217
-
218
-
219
-
220
-
221
-
222
-
223
-
224
-
225
-
226
-
227
-
228
-
229
-
230
-
231
-
232
-
233
-
234
-
235
-
236
-
237
-
238
-
239
-
240
-
241
-
242
-
243
-
244
-
245
-
246
-
247
-
248
-
249
-
250
-
251
-
252
-
253
-
254
-
255
-
256
-
257
-
258
-
259
-
260
-
261
-
262
-
263
-
264
-
265
-
266
-
267
-
268
-
269
-
270
-
271
-
272
-
273
-
274
-
275
-
276
-
277
-
278
-
279
-
280
-
281
-
282
-
283
-
284
-
285
-
286
-
287
-
288
-
289
-
290
-
291
-
292
-
293
-
294
-
295
-
296
-
297
-
298
-
299
-
300
-
301
-
302
-
303
-
304
-
305
-
306
-
307
-
308
-
309
-
310
-
311
-
312
-
313
-
314
-
315
-
316
-
317
-
318
-
319
-
320
-
321
-
322
-
323
-
324
-
325
-
326
-
327
-
328
-
329
-
330
-
331
-
332
-
333
-
334
-
335
-
336
-
337
-
338
-
339
-
340
-
341
-
342
-
343
-
344
-
345
-
346
-
347
-
348
-
349
-
350
-
351
-
352
-
353
-
354
-
355
-
356
-
357
-
358
-
359
-
360
-
361
-
362
-
363
-
364
-
365
-
366
-
367
-
368
-
369
-
370
-
371
-
372
-
373
-
374
-
375
-
376
-
377
-
378
-
379
-
380
-
381
-
382
-
383
-
384
-
385
-
386
-
387
-
388
-
389
-
390
-
391
-
392
-
393
-
394
-
395
-
396
-
397
-
398
-
399
-
400
-
401
-
402
-
403
-
404
-
405
-
406
-
407
-
408
-
409
-
410
-
411
-
412
-
413
-
414
-
415
-
416
-
417
-
418
-
419
-
420
-
421
-
422
-
423
-
424
-
425
-
426
-
427
-
428
-
429
-
430
-
431
-
432
-
433
-
434
-
435
-
436
-
437
-
438
-
439
-
440
-
441
-
442
-
443
-
444
-
445
-
446
-
447
-
448
-
449
-
450
-
451
-
452
-
453
-
454
-
455
-
456
-
457
-
458
-
459
-
460
-
461
-
462
-
463
-
464
-
465
-
466
-
467
-
468
-
469
-
470
-
471
-
472
-
473
-
474
-
475
-
476
-
477
-
478
-
479
-
480
-
481
-
482
-
483
-
484
-
485
-
486
-
487
-
488
-
489
-
490
-
491
-
492
-
493
-
494
-
495
-
496
-
497
-
498
-
499
-
500
-
501
-
502
-
503
-
504
 |
 |
37
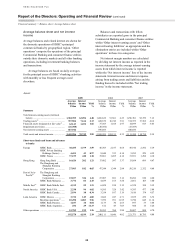
8 per cent increase in lending to customers
(excluding the financial sector and settlement
accounts).
Loan impairment charges rose significantly in
the US by 38 per cent to US$16.3 billion, due to
credit quality deterioration across all US portfolios
in Personal Financial Services.
In the US consumer lending portfolio, loan
impairment charges rose as delinquency rates
deteriorated sharply and the economy declined
markedly in the second half of 2008, most notably in
the first lien portfolio. This was particularly apparent
in the geographical regions most affected by house
price depreciation and rising unemployment rates. In
mortgage services, loan impairment charges rose as
2005 and 2006 vintages matured and moved into the
later stages of delinquency. This was partly offset by
the benefit of lower balances as run-off continued,
albeit at a slowing pace as house price depreciation
restricted refinancing options for customers. In
HSBC USA, loan impairment charges rose as credit
quality worsened across the real estate secured
portfolio and private label cards. Delinquencies rose
in the prime first lien residential mortgage portfolio,
Home Equity Line of Credit and Home Equity Loan
second lien portfolios. The higher delinquency rate
for prime first lien mortgages was in part due to
lower balances following US$7.0 billion of portfolio
sales during the year.
Loan impairment charges in the US card and
retail services portfolios rose, again driven by
increasing unemployment, portfolio seasoning,
higher levels of personal bankruptcy filings and
continued weakness in the US economy which was
most apparent in regions with the most significant
declines in house prices and rising unemployment.
Loan impairment charges in Commercial
Banking in North America more than doubled from
a low base in 2007, due to deterioration across the
commercial real estate, middle market and corporate
banking portfolios in the US and, to a lesser extent,
higher loan impairment charges against firms in the
manufacturing, export and commercial real estate
sectors in Canada.
In the UK, a modest decline in loan impairment
charges in Personal Financial Services reflected the
non-recurrence of a methodology change at HFC in
2007 which resulted in higher impairment charges.
Credit quality in the Personal Financial Services
portfolio remained broadly stable, reflecting early
risk mitigation through the tightening of lending
controls and the sale of non-core credit card
portfolios during the year. Credit quality in the
unsecured portfolios deteriorated slightly in 2008,
particularly in the second half of the year, due to the
weakening UK economy. Loan impairment charges
in the commercial portfolio rose in 2008 as the
weakening property market led to higher impairment
charges against construction companies and
businesses dependent upon the real estate sector,
particularly in the final quarter of the year.
Impairment charges against banks rose due to some
exposure to the Icelandic banks in 2008. In addition,
rising levels of personal indebtedness resulted in
lower releases and recoveries of charges than in
2007.
Higher loan impairment and other credit risk
provisions within Global Banking and Markets in
Europe reflected increased charges against certain
corporate accounts and impairment recorded on
available-for-sale debt securities.
In Mexico, loan impairment charges rose by
US$513 million or 69 per cent, primarily in the
credit card portfolio. This was due to a combination
of higher lending volumes from organic expansion
and higher delinquency rates which were driven by
a deterioration in credit quality as the portfolio
continued to season and move into the later stages of
delinquency. Management took action to enhance
collection activity and improve the quality of new
business. Impairment charges in the commercial
portfolio also rose due to credit quality deterioration
among small and medium-sized enterprises as the
economy weakened.
In Hong Kong, the rise in loan impairment
charges was driven by weakness in parts of the
export sector within the commercial portfolio in the
second half of 2008. In Global Banking and Markets,
credit impairment charges within Balance Sheet
Management principally reflected losses on debt
securities and paper issued by financial institutions
previously rated at investment grade which failed in
the year.
In Rest of Asia-Pacific, the growth in loan
impairment charges reflected a combination of the
expansion of consumer lending and credit quality
deterioration in India and the Middle East. In
addition, higher impairment charges in Commercial
Banking were driven by a deterioration in credit
quality in the second half of the year.
For the Group as a whole, the aggregate
outstanding customer loan impairment allowances
at 31 December 2008 of US$23.9 billion represented
2.6 per cent of gross customer advances (net of
reverse repos and settlement accounts), compared
with 2 per cent at 31 December 2007.