HSBC 2009 Annual Report Download - page 241
Download and view the complete annual report
Please find page 241 of the 2009 HSBC annual report below. You can navigate through the pages in the report by either clicking on the pages listed below, or by using the keyword search tool below to find specific information within the annual report.-
 1
1 -
2
-
3
-
4
-
5
-
6
-
7
-
8
-
9
-
10
-
11
-
12
-
13
-
14
-
15
-
16
-
17
-
18
-
19
-
20
-
21
-
22
-
23
-
24
-
25
-
26
-
27
-
28
-
29
-
30
-
31
-
32
-
33
-
34
-
35
-
36
-
37
-
38
-
39
-
40
-
41
-
42
-
43
-
44
-
45
-
46
-
47
-
48
-
49
-
50
-
51
-
52
-
53
-
54
-
55
-
56
-
57
-
58
-
59
-
60
-
61
-
62
-
63
-
64
-
65
-
66
-
67
-
68
-
69
-
70
-
71
-
72
-
73
-
74
-
75
-
76
-
77
-
78
-
79
-
80
-
81
-
82
-
83
-
84
-
85
-
86
-
87
-
88
-
89
-
90
-
91
-
92
-
93
-
94
-
95
-
96
-
97
-
98
-
99
-
100
-
101
-
102
-
103
-
104
-
105
-
106
-
107
-
108
-
109
-
110
-
111
-
112
-
113
-
114
-
115
-
116
-
117
-
118
-
119
-
120
-
121
-
122
-
123
-
124
-
125
-
126
-
127
-
128
-
129
-
130
-
131
-
132
-
133
-
134
-
135
-
136
-
137
-
138
-
139
-
140
-
141
-
142
-
143
-
144
-
145
-
146
-
147
-
148
-
149
-
150
-
151
-
152
-
153
-
154
-
155
-
156
-
157
-
158
-
159
-
160
-
161
-
162
-
163
-
164
-
165
-
166
-
167
-
168
-
169
-
170
-
171
-
172
-
173
-
174
-
175
-
176
-
177
-
178
-
179
-
180
-
181
-
182
-
183
-
184
-
185
-
186
-
187
-
188
-
189
-
190
-
191
-
192
-
193
-
194
-
195
-
196
-
197
-
198
-
199
-
200
-
201
-
202
-
203
-
204
-
205
-
206
-
207
-
208
-
209
-
210
-
211
-
212
-
213
-
214
-
215
-
216
-
217
-
218
-
219
-
220
-
221
-
222
-
223
-
224
-
225
-
226
-
227
-
228
-
229
-
230
-
 231
231 -
 232
232 -
 233
233 -
 234
234 -
 235
235 -
 236
236 -
 237
237 -
 238
238 -
 239
239 -
 240
240 -
 241
241 -
 242
242 -
 243
243 -
 244
244 -
 245
245 -
 246
246 -
 247
247 -
 248
248 -
 249
249 -
 250
250 -
 251
251 -
252
-
253
-
254
-
255
-
256
-
257
-
258
-
259
-
260
-
261
-
262
-
263
-
264
-
265
-
266
-
267
-
268
-
269
-
270
-
271
-
272
-
273
-
274
-
275
-
276
-
277
-
278
-
279
-
280
-
281
-
282
-
283
-
284
-
285
-
286
-
287
-
288
-
289
-
290
-
291
-
292
-
293
-
294
-
295
-
296
-
297
-
298
-
299
-
300
-
301
-
302
-
303
-
304
-
305
-
306
-
307
-
308
-
309
-
310
-
311
-
312
-
313
-
314
-
315
-
316
-
317
-
318
-
319
-
320
-
321
-
322
-
323
-
324
-
325
-
326
-
327
-
328
-
329
-
330
-
331
-
332
-
333
-
334
-
335
-
336
-
337
-
338
-
339
-
340
-
341
-
342
-
343
-
344
-
345
-
346
-
347
-
348
-
349
-
350
-
351
-
352
-
353
-
354
-
355
-
356
-
357
-
358
-
359
-
360
-
361
-
362
-
363
-
364
-
365
-
366
-
367
-
368
-
369
-
370
-
371
-
372
-
373
-
374
-
375
-
376
-
377
-
378
-
379
-
380
-
381
-
382
-
383
-
384
-
385
-
386
-
387
-
388
-
389
-
390
-
391
-
392
-
393
-
394
-
395
-
396
-
397
-
398
-
399
-
400
-
401
-
402
-
403
-
404
-
405
-
406
-
407
-
408
-
409
-
410
-
411
-
412
-
413
-
414
-
415
-
416
-
417
-
418
-
419
-
420
-
421
-
422
-
423
-
424
-
425
-
426
-
427
-
428
-
429
-
430
-
431
-
432
-
433
-
434
-
435
-
436
-
437
-
438
-
439
-
440
-
441
-
442
-
443
-
444
-
445
-
446
-
447
-
448
-
449
-
450
-
451
-
452
-
453
-
454
-
455
-
456
-
457
-
458
-
459
-
460
-
461
-
462
-
463
-
464
-
465
-
466
-
467
-
468
-
469
-
470
-
471
-
472
-
473
-
474
-
475
-
476
-
477
-
478
-
479
-
480
-
481
-
482
-
483
-
484
-
485
-
486
-
487
-
488
-
489
-
490
-
491
-
492
-
493
-
494
-
495
-
496
-
497
-
498
-
499
-
500
-
501
-
502
-
503
-
504
 |
 |

239
in unemployment and bankruptcy filings. Impaired
loans were broadly stable at US$846 million.
In Rest of Asia-Pacific, new loan impairment
allowances rose by 18 per cent to US$1.1 billion,
mainly due to increased delinquencies on unsecured
lending, particularly in the credit card and personal
lending portfolios in India and, to a lesser extent,
in Indonesia. In the corporate and commercial
portfolios, new loan impairment allowances
increased, reflecting a deterioration in India’s
economic conditions. Impaired loans increased
by 44 per cent to US$1.2 billion.
Releases and recoveries in the Rest of
Asia-Pacific region rose by 42 per cent to
US$214 million at 31 December 2009.
New loan impairment allowances in the Middle
East increased significantly from a low base, to
US$1.4 billion. The increase reflected higher charges
in the UAE, largely in Dubai, due to a marked
deterioration in credit quality which particularly
affected the real estate and construction industries.
Infrastructure projects were delayed or cancelled and
unemployment levels increased. Delinquency rates
rose as a result, particularly in the credit card and
personal loan portfolios. Impaired loans increased by
US$1.4 billion to US$1.7 billion.
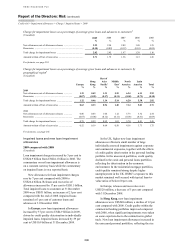
New loan impairment allowances rose by
7 per cent to US$26.4 billion despite falls of
12 per cent in Hong Kong and 7 per cent in
North America.
In North America, new loan impairment
allowances declined by 7 per cent to US$15.6 billion
against the backdrop of a widespread rise in
unemployment, continued weakness in the US
economy and housing markets, higher levels of
personal bankruptcy filings and portfolio seasoning.
This decline was the result of lower loan impairment
charges in the Mortgage Services real estate secured,
credit card and vehicle finance portfolios, partially
offset by higher loan impairment charges in the
branch-based Consumer Lending business. Apart
from the changes made to the write-off period, the
main contributing factors were as follows:
• new loan impairment allowances in the
Mortgage Services business decreased in 2009
as the portfolio continued to run off. While loss
severities increased compared with 2008, a
higher percentage of impairment was in respect
of first lien loans which have less severity than
second lien loans;
• new loan impairment allowances in the vehicle
finance loan portfolio decreased as a result of
lower loan levels reflecting the discontinuance
of vehicle finance originations in July 2008. In
addition, loss severities decreased as prices on
repossessed vehicles improved; and
• new loan impairment allowances in the branch-
based Consumer Lending business increased in
2009, primarily in the unsecured portfolio due to
the deterioration in the 2006 and 2007 vintages
which were more pronounced in certain
geographic regions and, to a lesser extent, first
lien real estate secured loans. These increases
were partially offset by lower new loan
impairment allowances for second lien real
estate secured loans.
New loan impairment allowances in the Cards
and Retail Services portfolios declined due to lower
outstanding balances and management action taken
in the past two years to constrain origination
activities in riskier segments. In addition,
impairment provisioning reflects an improved
outlook on future loss estimates as the impact of
higher unemployment rates on losses has not been as
severe as initially expected due, in part, to lower fuel
prices and the boost to cash flow provided by
government stimulus programmes that meaningfully
benefit non-prime customers. In HSBC Bank USA
personal lending portfolios, new loan impairment
allowances increased, mainly in prime residential
mortgage lending.
New loan impairment allowances in the
corporate and commercial lending portfolios
increased as the weaker economy affected firms in
the commercial real estate and construction sectors
in the US. In Canada, higher new loan impairment
allowances were primarily against exposures in the
commercial real estate, manufacturing and trade
sectors.
In North America, releases and recoveries
increased by 14 per cent to US$205 million at
31 December 2009 due to an increase in the
repayment of loans previously impaired in the
corporate, commercial and financial portfolios.
Impaired loans decreased by 7 per cent to
US$13.3 billion at 31 December 2009.
New loan impairment allowances in Latin
America increased by 18 per cent to US$2.9 billion,
while impaired loans rose by 27 per cent to
US$3.0 billion. The increase in new loan impairment
allowances in Brazil was driven by higher
delinquencies, mainly in credit cards, overdrafts and
payroll loans, due to higher unemployment. In the
commercial portfolio, higher new loan impairment
allowances reflected the challenging economic