HSBC 2009 Annual Report Download - page 44
Download and view the complete annual report
Please find page 44 of the 2009 HSBC annual report below. You can navigate through the pages in the report by either clicking on the pages listed below, or by using the keyword search tool below to find specific information within the annual report.-
 1
1 -
2
-
3
-
4
-
5
-
6
-
7
-
8
-
9
-
10
-
11
-
12
-
13
-
14
-
15
-
16
-
17
-
18
-
19
-
20
-
21
-
22
-
23
-
24
-
25
-
26
-
27
-
28
-
29
-
30
-
31
-
32
-
33
-
 34
34 -
 35
35 -
 36
36 -
 37
37 -
 38
38 -
 39
39 -
 40
40 -
 41
41 -
 42
42 -
 43
43 -
 44
44 -
 45
45 -
 46
46 -
 47
47 -
 48
48 -
 49
49 -
 50
50 -
 51
51 -
 52
52 -
 53
53 -
 54
54 -
55
-
56
-
57
-
58
-
59
-
60
-
61
-
62
-
63
-
64
-
65
-
66
-
67
-
68
-
69
-
70
-
71
-
72
-
73
-
74
-
75
-
76
-
77
-
78
-
79
-
80
-
81
-
82
-
83
-
84
-
85
-
86
-
87
-
88
-
89
-
90
-
91
-
92
-
93
-
94
-
95
-
96
-
97
-
98
-
99
-
100
-
101
-
102
-
103
-
104
-
105
-
106
-
107
-
108
-
109
-
110
-
111
-
112
-
113
-
114
-
115
-
116
-
117
-
118
-
119
-
120
-
121
-
122
-
123
-
124
-
125
-
126
-
127
-
128
-
129
-
130
-
131
-
132
-
133
-
134
-
135
-
136
-
137
-
138
-
139
-
140
-
141
-
142
-
143
-
144
-
145
-
146
-
147
-
148
-
149
-
150
-
151
-
152
-
153
-
154
-
155
-
156
-
157
-
158
-
159
-
160
-
161
-
162
-
163
-
164
-
165
-
166
-
167
-
168
-
169
-
170
-
171
-
172
-
173
-
174
-
175
-
176
-
177
-
178
-
179
-
180
-
181
-
182
-
183
-
184
-
185
-
186
-
187
-
188
-
189
-
190
-
191
-
192
-
193
-
194
-
195
-
196
-
197
-
198
-
199
-
200
-
201
-
202
-
203
-
204
-
205
-
206
-
207
-
208
-
209
-
210
-
211
-
212
-
213
-
214
-
215
-
216
-
217
-
218
-
219
-
220
-
221
-
222
-
223
-
224
-
225
-
226
-
227
-
228
-
229
-
230
-
231
-
232
-
233
-
234
-
235
-
236
-
237
-
238
-
239
-
240
-
241
-
242
-
243
-
244
-
245
-
246
-
247
-
248
-
249
-
250
-
251
-
252
-
253
-
254
-
255
-
256
-
257
-
258
-
259
-
260
-
261
-
262
-
263
-
264
-
265
-
266
-
267
-
268
-
269
-
270
-
271
-
272
-
273
-
274
-
275
-
276
-
277
-
278
-
279
-
280
-
281
-
282
-
283
-
284
-
285
-
286
-
287
-
288
-
289
-
290
-
291
-
292
-
293
-
294
-
295
-
296
-
297
-
298
-
299
-
300
-
301
-
302
-
303
-
304
-
305
-
306
-
307
-
308
-
309
-
310
-
311
-
312
-
313
-
314
-
315
-
316
-
317
-
318
-
319
-
320
-
321
-
322
-
323
-
324
-
325
-
326
-
327
-
328
-
329
-
330
-
331
-
332
-
333
-
334
-
335
-
336
-
337
-
338
-
339
-
340
-
341
-
342
-
343
-
344
-
345
-
346
-
347
-
348
-
349
-
350
-
351
-
352
-
353
-
354
-
355
-
356
-
357
-
358
-
359
-
360
-
361
-
362
-
363
-
364
-
365
-
366
-
367
-
368
-
369
-
370
-
371
-
372
-
373
-
374
-
375
-
376
-
377
-
378
-
379
-
380
-
381
-
382
-
383
-
384
-
385
-
386
-
387
-
388
-
389
-
390
-
391
-
392
-
393
-
394
-
395
-
396
-
397
-
398
-
399
-
400
-
401
-
402
-
403
-
404
-
405
-
406
-
407
-
408
-
409
-
410
-
411
-
412
-
413
-
414
-
415
-
416
-
417
-
418
-
419
-
420
-
421
-
422
-
423
-
424
-
425
-
426
-
427
-
428
-
429
-
430
-
431
-
432
-
433
-
434
-
435
-
436
-
437
-
438
-
439
-
440
-
441
-
442
-
443
-
444
-
445
-
446
-
447
-
448
-
449
-
450
-
451
-
452
-
453
-
454
-
455
-
456
-
457
-
458
-
459
-
460
-
461
-
462
-
463
-
464
-
465
-
466
-
467
-
468
-
469
-
470
-
471
-
472
-
473
-
474
-
475
-
476
-
477
-
478
-
479
-
480
-
481
-
482
-
483
-
484
-
485
-
486
-
487
-
488
-
489
-
490
-
491
-
492
-
493
-
494
-
495
-
496
-
497
-
498
-
499
-
500
-
501
-
502
-
503
-
504
 |
 |

HSBC HOLDINGS PLC
Report of the Directors: Operating and Financial Review (continued)
Financial summary > Balance sheet > Movement in 2009
42
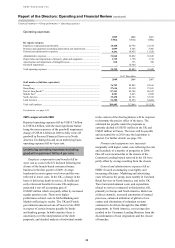
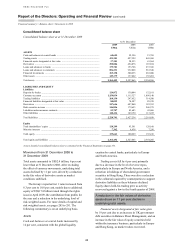
Consolidated balance sheet
Consolidated balance sheet as at 31 December 2009
At 31 December
2009
US$m
2008
US$m
2007
US$m
ASSETS
Cash and balances at central banks ......................................................................... 60,655 52,396 21,765
Trading assets .......................................................................................................... 421,381 427,329 445,968
Financial assets designated at fair value ................................................................. 37,181 28,533 41,564
Derivatives ............................................................................................................... 250,886 494,876 187,854
Loans and advances to banks .................................................................................. 179,781 153,766 237,366
Loans and advances to customers ........................................................................... 896,231 932,868 981,548
Financial investments .............................................................................................. 369,158 300,235 283,000
Other assets .............................................................................................................. 149,179 137,462 155,201
Total assets .............................................................................................................. 2,364,452 2,527,465 2,354,266
LIABILITIES AND EQUITY
Liabilities
Deposits by banks .................................................................................................... 124,872 130,084 132,181
Customer accounts ................................................................................................... 1,159,034 1,115,327 1,096,140
Trading liabilities ..................................................................................................... 268,130 247,652 314,580
Financial liabilities designated at fair value ............................................................ 80,092 74,587 89,939
Derivatives ............................................................................................................... 247,646 487,060 183,393
Debt securities in issue ............................................................................................ 146,896 179,693 246,579
Liabilities under insurance contracts ....................................................................... 53,707 43,683 42,606
Other liabilities ........................................................................................................ 148,414 149,150 113,432
Total liabilities ......................................................................................................... 2,228,791 2,427,236 2,218,850
Equity
Total shareholders’ equity ....................................................................................... 128,299 93,591 128,160
Minority interests ..................................................................................................... 7,362 6,638 7,256
Total equity .............................................................................................................. 135,661 100,229 135,416
Total equity and liabilities ....................................................................................... 2,364,452 2,527,465 2,354,266
A more detailed consolidated balance sheet is contained in the Financial Statements on page 355.
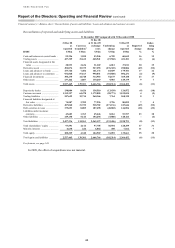
Movement from 31 December 2008 to
31 December 2009
Total assets amounted to US$2.4 trillion, 6 per cent
lower than at 31 December 2008. After excluding
the effect of currency movements, underlying total
assets declined by 11 per cent, driven by a reduction
in the fair value of derivative assets as market
conditions stabilised.
The Group’s reported tier 1 ratio increased from
8.3 per cent to 10.8 per cent, mainly due to additional
equity of US$17.8 billion raised through the rights
issue in April 2009, the contribution from profits for
the year and a reduction in the underlying level of
risk-weighted assets. For more details of capital and
risk weighted assets, see pages 285 to 291. The
following commentary is on an underlying basis.
Assets
Cash and balances at central banks increased by
12 per cent, consistent with the global liquidity
creation by central banks, particularly in Europe
and North America.
Trading assets fell by 6 per cent, primarily
due to a decrease in the level of reverse repos,
particularly in Europe and North America, and a
reduction in holdings of short-dated government
securities in Hong Kong. There was also a reduction
in the collateral required by counterparties to support
derivative liabilities as these balances declined.
Equity shares held-for-trading grew as activity
recovered against a low in the fourth quarter of 2008.
A reduction in the fair values of derivative
assets drove an 11 per cent decline in
underlying total assets.
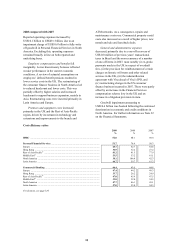
Financial assets designated at fair value grew
by 19 per cent due to an increase in UK government
debt securities in Balance Sheet Management, and an
increase in the fair value of equity securities held
within the insurance business, particularly in Europe
and Hong Kong, as market values recovered.