HSBC 2009 Annual Report Download - page 45
Download and view the complete annual report
Please find page 45 of the 2009 HSBC annual report below. You can navigate through the pages in the report by either clicking on the pages listed below, or by using the keyword search tool below to find specific information within the annual report.-
 1
1 -
2
-
3
-
4
-
5
-
6
-
7
-
8
-
9
-
10
-
11
-
12
-
13
-
14
-
15
-
16
-
17
-
18
-
19
-
20
-
21
-
22
-
23
-
24
-
25
-
26
-
27
-
28
-
29
-
30
-
31
-
32
-
33
-
34
-
 35
35 -
 36
36 -
 37
37 -
 38
38 -
 39
39 -
 40
40 -
 41
41 -
 42
42 -
 43
43 -
 44
44 -
 45
45 -
 46
46 -
 47
47 -
 48
48 -
 49
49 -
 50
50 -
 51
51 -
 52
52 -
 53
53 -
 54
54 -
 55
55 -
56
-
57
-
58
-
59
-
60
-
61
-
62
-
63
-
64
-
65
-
66
-
67
-
68
-
69
-
70
-
71
-
72
-
73
-
74
-
75
-
76
-
77
-
78
-
79
-
80
-
81
-
82
-
83
-
84
-
85
-
86
-
87
-
88
-
89
-
90
-
91
-
92
-
93
-
94
-
95
-
96
-
97
-
98
-
99
-
100
-
101
-
102
-
103
-
104
-
105
-
106
-
107
-
108
-
109
-
110
-
111
-
112
-
113
-
114
-
115
-
116
-
117
-
118
-
119
-
120
-
121
-
122
-
123
-
124
-
125
-
126
-
127
-
128
-
129
-
130
-
131
-
132
-
133
-
134
-
135
-
136
-
137
-
138
-
139
-
140
-
141
-
142
-
143
-
144
-
145
-
146
-
147
-
148
-
149
-
150
-
151
-
152
-
153
-
154
-
155
-
156
-
157
-
158
-
159
-
160
-
161
-
162
-
163
-
164
-
165
-
166
-
167
-
168
-
169
-
170
-
171
-
172
-
173
-
174
-
175
-
176
-
177
-
178
-
179
-
180
-
181
-
182
-
183
-
184
-
185
-
186
-
187
-
188
-
189
-
190
-
191
-
192
-
193
-
194
-
195
-
196
-
197
-
198
-
199
-
200
-
201
-
202
-
203
-
204
-
205
-
206
-
207
-
208
-
209
-
210
-
211
-
212
-
213
-
214
-
215
-
216
-
217
-
218
-
219
-
220
-
221
-
222
-
223
-
224
-
225
-
226
-
227
-
228
-
229
-
230
-
231
-
232
-
233
-
234
-
235
-
236
-
237
-
238
-
239
-
240
-
241
-
242
-
243
-
244
-
245
-
246
-
247
-
248
-
249
-
250
-
251
-
252
-
253
-
254
-
255
-
256
-
257
-
258
-
259
-
260
-
261
-
262
-
263
-
264
-
265
-
266
-
267
-
268
-
269
-
270
-
271
-
272
-
273
-
274
-
275
-
276
-
277
-
278
-
279
-
280
-
281
-
282
-
283
-
284
-
285
-
286
-
287
-
288
-
289
-
290
-
291
-
292
-
293
-
294
-
295
-
296
-
297
-
298
-
299
-
300
-
301
-
302
-
303
-
304
-
305
-
306
-
307
-
308
-
309
-
310
-
311
-
312
-
313
-
314
-
315
-
316
-
317
-
318
-
319
-
320
-
321
-
322
-
323
-
324
-
325
-
326
-
327
-
328
-
329
-
330
-
331
-
332
-
333
-
334
-
335
-
336
-
337
-
338
-
339
-
340
-
341
-
342
-
343
-
344
-
345
-
346
-
347
-
348
-
349
-
350
-
351
-
352
-
353
-
354
-
355
-
356
-
357
-
358
-
359
-
360
-
361
-
362
-
363
-
364
-
365
-
366
-
367
-
368
-
369
-
370
-
371
-
372
-
373
-
374
-
375
-
376
-
377
-
378
-
379
-
380
-
381
-
382
-
383
-
384
-
385
-
386
-
387
-
388
-
389
-
390
-
391
-
392
-
393
-
394
-
395
-
396
-
397
-
398
-
399
-
400
-
401
-
402
-
403
-
404
-
405
-
406
-
407
-
408
-
409
-
410
-
411
-
412
-
413
-
414
-
415
-
416
-
417
-
418
-
419
-
420
-
421
-
422
-
423
-
424
-
425
-
426
-
427
-
428
-
429
-
430
-
431
-
432
-
433
-
434
-
435
-
436
-
437
-
438
-
439
-
440
-
441
-
442
-
443
-
444
-
445
-
446
-
447
-
448
-
449
-
450
-
451
-
452
-
453
-
454
-
455
-
456
-
457
-
458
-
459
-
460
-
461
-
462
-
463
-
464
-
465
-
466
-
467
-
468
-
469
-
470
-
471
-
472
-
473
-
474
-
475
-
476
-
477
-
478
-
479
-
480
-
481
-
482
-
483
-
484
-
485
-
486
-
487
-
488
-
489
-
490
-
491
-
492
-
493
-
494
-
495
-
496
-
497
-
498
-
499
-
500
-
501
-
502
-
503
-
504
 |
 |
43
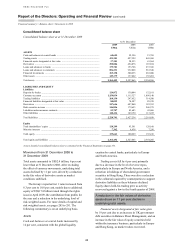
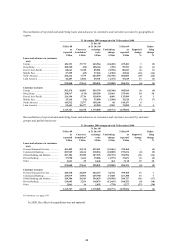
Derivative assets declined by 52 per cent with
reductions across all classes of asset, notably foreign
exchange, interest rate and credit derivatives. Lower
volatility within the financial markets, steepening
yield curves in major currencies and narrowing
credit spreads led to a fall in the fair value of
outstanding derivative contracts.
Loans and advances to banks increased by
12 per cent, mainly in Hong Kong and Rest of Asia-
Pacific, where surplus funds were placed on a
short-term basis with financial institutions and
central banks as part of Balance Sheet Management
activities.
Loans and advances to customers fell by 9 per
cent, driven by a reduction in balances in North
America due to the run-off of the consumer finance
businesses, the sale of selected portfolios, and a
reduction in Treasury reverse repo balances and cash
collateral as excess liquidity was placed in other
investments. These factors were compounded by
declines in balances in other regions, particularly
in the first half of the year, due to customer
deleveraging and lower credit origination in certain
segments as risk appetite reduced and customer
demand declined. In the UK, there was also a
reduction in customer overdraft balances that are
managed on a net basis but reported gross under
IFRSs. Mortgage balances increased strongly in the
UK and Hong Kong as HSBC targeted growth in
these markets, although this was largely offset by the
run-off of balances in the US, as noted above.
Financial investments rose by 17 per cent,
mainly in Hong Kong driven by purchases of Hong
Kong government and other highly-rated securities
in the year. This increase was partly offset by a fall
in financial investments in Europe, as a result of debt
securities that matured and were not replaced.
Other assets grew by 7 per cent compared with
31 December 2008.
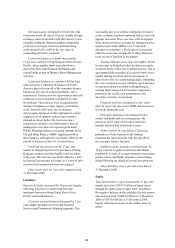
Liabilities
Deposits by banks decreased by 10 per cent, largely
reflecting a decline in central bank and other
interbank deposits in Hong Kong, Rest of Asia-
Pacific and North America.
Customer account balances decreased by 2 per
cent, despite growth in the Personal Financial
Services and Commercial Banking segments. This
was mainly due to an outflow of deposits in Europe
as the economic situation improved and investor risk
appetite increased. There was also a fall in deposits
from customers whose accounts are managed net but
reported gross under IFRSs, (see ‘Loans and
advances to customers’). These factors were partly
offset by an increase in deposits in Hong Kong due
to an excess of liquidity in the market.
Trading liabilities were 3 per cent higher, driven
by increases in hedged net short positions on equity
securities in line with a rise in market activity, and in
government debt securities as a result of more active
market making activities and an expectation of
interest rate rises on certain trading desks. Offsetting
this was a reduction in repo contracts, and a decrease
in structured deposit accounts in Hong Kong as
existing deals matured and customers expressed a
preference for vanilla cash instruments in the
uncertain economic environment.
Financial liabilities designated at fair value
grew by 4 per cent due to new HSBC debt issuances
in Europe during the year.
Derivative businesses are managed within
market risk limits and, as a consequence, the
reduction in the value of derivative liabilities
broadly matched that of derivative assets.
Debt securities in issue fell by 22 per cent,
primarily in North America as the funding
requirements reduced in line with the run-off of
the consumer finance business.
Liabilities under insurance contracts grew by
18 per cent due to gains recorded on unit-linked
products as a result of an improvement in investment
market values, and higher insurance sales in Hong
Kong following the launch of several new products.
Other liabilities were 4 per cent lower than at
31 December 2008.
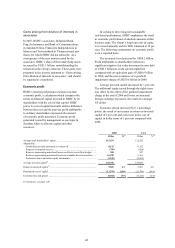
Equity
Total shareholders’ equity increased by 31 per cent,
mainly due to the US$17.8 billion of funds raised
through the rights issue in April 2009. In addition,
the negative balance on the available-for-sale reserve
also declined from US$20.6 billion at 31 December
2008 to US$10.0 billion at 31 December 2009,
largely reflecting increases in the market value of
assets.