HSBC 2009 Annual Report Download - page 5
Download and view the complete annual report
Please find page 5 of the 2009 HSBC annual report below. You can navigate through the pages in the report by either clicking on the pages listed below, or by using the keyword search tool below to find specific information within the annual report.-
 1
1 -
 2
2 -
 3
3 -
 4
4 -
 5
5 -
 6
6 -
 7
7 -
 8
8 -
 9
9 -
 10
10 -
 11
11 -
 12
12 -
 13
13 -
 14
14 -
 15
15 -
 16
16 -
17
-
18
-
19
-
20
-
21
-
22
-
23
-
24
-
25
-
26
-
27
-
28
-
29
-
30
-
31
-
32
-
33
-
34
-
35
-
36
-
37
-
38
-
39
-
40
-
41
-
42
-
43
-
44
-
45
-
46
-
47
-
48
-
49
-
50
-
51
-
52
-
53
-
54
-
55
-
56
-
57
-
58
-
59
-
60
-
61
-
62
-
63
-
64
-
65
-
66
-
67
-
68
-
69
-
70
-
71
-
72
-
73
-
74
-
75
-
76
-
77
-
78
-
79
-
80
-
81
-
82
-
83
-
84
-
85
-
86
-
87
-
88
-
89
-
90
-
91
-
92
-
93
-
94
-
95
-
96
-
97
-
98
-
99
-
100
-
101
-
102
-
103
-
104
-
105
-
106
-
107
-
108
-
109
-
110
-
111
-
112
-
113
-
114
-
115
-
116
-
117
-
118
-
119
-
120
-
121
-
122
-
123
-
124
-
125
-
126
-
127
-
128
-
129
-
130
-
131
-
132
-
133
-
134
-
135
-
136
-
137
-
138
-
139
-
140
-
141
-
142
-
143
-
144
-
145
-
146
-
147
-
148
-
149
-
150
-
151
-
152
-
153
-
154
-
155
-
156
-
157
-
158
-
159
-
160
-
161
-
162
-
163
-
164
-
165
-
166
-
167
-
168
-
169
-
170
-
171
-
172
-
173
-
174
-
175
-
176
-
177
-
178
-
179
-
180
-
181
-
182
-
183
-
184
-
185
-
186
-
187
-
188
-
189
-
190
-
191
-
192
-
193
-
194
-
195
-
196
-
197
-
198
-
199
-
200
-
201
-
202
-
203
-
204
-
205
-
206
-
207
-
208
-
209
-
210
-
211
-
212
-
213
-
214
-
215
-
216
-
217
-
218
-
219
-
220
-
221
-
222
-
223
-
224
-
225
-
226
-
227
-
228
-
229
-
230
-
231
-
232
-
233
-
234
-
235
-
236
-
237
-
238
-
239
-
240
-
241
-
242
-
243
-
244
-
245
-
246
-
247
-
248
-
249
-
250
-
251
-
252
-
253
-
254
-
255
-
256
-
257
-
258
-
259
-
260
-
261
-
262
-
263
-
264
-
265
-
266
-
267
-
268
-
269
-
270
-
271
-
272
-
273
-
274
-
275
-
276
-
277
-
278
-
279
-
280
-
281
-
282
-
283
-
284
-
285
-
286
-
287
-
288
-
289
-
290
-
291
-
292
-
293
-
294
-
295
-
296
-
297
-
298
-
299
-
300
-
301
-
302
-
303
-
304
-
305
-
306
-
307
-
308
-
309
-
310
-
311
-
312
-
313
-
314
-
315
-
316
-
317
-
318
-
319
-
320
-
321
-
322
-
323
-
324
-
325
-
326
-
327
-
328
-
329
-
330
-
331
-
332
-
333
-
334
-
335
-
336
-
337
-
338
-
339
-
340
-
341
-
342
-
343
-
344
-
345
-
346
-
347
-
348
-
349
-
350
-
351
-
352
-
353
-
354
-
355
-
356
-
357
-
358
-
359
-
360
-
361
-
362
-
363
-
364
-
365
-
366
-
367
-
368
-
369
-
370
-
371
-
372
-
373
-
374
-
375
-
376
-
377
-
378
-
379
-
380
-
381
-
382
-
383
-
384
-
385
-
386
-
387
-
388
-
389
-
390
-
391
-
392
-
393
-
394
-
395
-
396
-
397
-
398
-
399
-
400
-
401
-
402
-
403
-
404
-
405
-
406
-
407
-
408
-
409
-
410
-
411
-
412
-
413
-
414
-
415
-
416
-
417
-
418
-
419
-
420
-
421
-
422
-
423
-
424
-
425
-
426
-
427
-
428
-
429
-
430
-
431
-
432
-
433
-
434
-
435
-
436
-
437
-
438
-
439
-
440
-
441
-
442
-
443
-
444
-
445
-
446
-
447
-
448
-
449
-
450
-
451
-
452
-
453
-
454
-
455
-
456
-
457
-
458
-
459
-
460
-
461
-
462
-
463
-
464
-
465
-
466
-
467
-
468
-
469
-
470
-
471
-
472
-
473
-
474
-
475
-
476
-
477
-
478
-
479
-
480
-
481
-
482
-
483
-
484
-
485
-
486
-
487
-
488
-
489
-
490
-
491
-
492
-
493
-
494
-
495
-
496
-
497
-
498
-
499
-
500
-
501
-
502
-
503
-
504
 |
 |

3
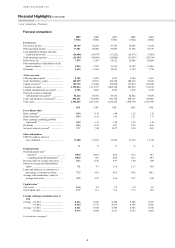
Capital and performance ratios
2009 2008
% %
Capital ratios
Core tier 1 ratio ........................................................................................................................................ 9.4 7.0
Tier 1 ratio ............................................................................................................................................... 10.8 8.3
Total capital ratio ..................................................................................................................................... 13.7 11.4
Performance ratios
Return on average invested capital2 ......................................................................................................... 4.1 4.0
Return on average total shareholders’ equity3 ......................................................................................... 5.1 4.7
Post-tax return on average total assets .................................................................................................... 0.27 0.26
Post-tax return on average risk-weighted assets ..................................................................................... 0.58 0.55
Credit coverage ratios
Loan impairment charges as a percentage of total operating income ..................................................... 31.72 27.24
Loan impairment charges as a percentage of average gross customer advances .................................... 2.82 2.45
Total impairment allowances outstanding as a percentage of impaired loans at the year-end ............... 83.2 94.3
Efficiency and revenue mix ratios
Cost efficiency ratio4
– reported ............................................................................................................................................. 52.0 60.1
– excluding goodwill impairment5 ...................................................................................................... 52.0 47.2
As a percentage of total operating income:
– net interest income ........................................................................................................................... 51.8 48.1
– net fee income .................................................................................................................................. 22.5 22.6
– net trading income ............................................................................................................................ 12.5 7.4
Financial ratios
Loans and advances to customers as a percentage of customer accounts ............................................... 77.3 83.6
Average total shareholders’ equity to average total assets ..................................................................... 4.72 4.87
Share information at the year-end
2009 2008
US$0.50 ordinary shares in issue (million) ............................................................................................. 17,408 12,105
Market capitalisation (billion) ................................................................................................................. US$199 US$114
Closing market price per ordinary share:6
– London .............................................................................................................................................. £7.09 £5.77
– Hong Kong ....................................................................................................................................... HK$89.40 HK$67.81
Closing market price per American Depositary Share7 ........................................................................... US$57.09 US$44.15
Over 1 year Over 3 years Over 5 years
HSBC total shareholder return to 31 December 20098 ........................................... 128.3 103.6 120.6
Benchmarks:
– FTSE 1009 ........................................................................................................ 127.3 98.0 135.4
– MSCI World10 .................................................................................................. 116.7 103.6 134.9
– MSCI Banks11 ................................................................................................... 125.2 70.6 92.3
Return on average invested capital
(per cent)
Cost efficiency ratio
(per cent)
15.9
14.9
15.3
4.0
4.1
2005
2006
2007
2008
2009
51.2
51.3
49.4
60.1
52.0
2005
2006
2007
2008
2009
For footnotes, see page 5.