Frontier Communications 2014 Annual Report Download - page 9
Download and view the complete annual report
Please find page 9 of the 2014 Frontier Communications annual report below. You can navigate through the pages in the report by either clicking on the pages listed below, or by using the keyword search tool below to find specific information within the annual report.-
 1
1 -
 2
2 -
 3
3 -
 4
4 -
 5
5 -
 6
6 -
 7
7 -
 8
8 -
 9
9 -
 10
10 -
 11
11 -
 12
12 -
 13
13 -
 14
14 -
 15
15 -
 16
16 -
 17
17 -
 18
18 -
 19
19 -
 20
20 -
21
-
22
-
23
-
24
-
25
-
26
-
27
-
28
-
29
-
30
-
31
-
32
-
33
-
34
-
35
-
36
-
37
-
38
-
39
-
40
-
41
-
42
-
43
-
44
-
45
-
46
-
47
-
48
-
49
-
50
-
51
-
52
-
53
-
54
-
55
-
56
-
57
-
58
-
59
-
60
-
61
-
62
-
63
-
64
-
65
-
66
-
67
-
68
-
69
-
70
-
71
-
72
-
73
-
74
-
75
-
76
-
77
-
78
-
79
-
80
-
81
-
82
-
83
-
84
-
85
-
86
-
87
-
88
-
89
-
90
-
91
-
92
-
93
-
94
-
95
-
96
-
97
-
98
-
99
-
100
-
101
-
102
-
103
-
104
-
105
-
106
-
107
-
108
 |
 |

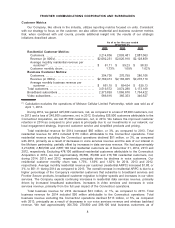
Customer Metrics
Our Company, like others in the industry, utilizes reporting metrics focused on units. Consistent
with our strategy to focus on the customer, we also utilize residential and business customer metrics
that, when combined with unit counts, provide additional insight into the results of our strategic
initiatives described above.
2014 2013 2012
As of or for the year ended
December 31,
Residential Customer Metrics:
Customers. . . . . . . . . . . . . . . . . . . . . . . . . . . . . . . . . . . . . 3,214,836 2,803,481 2,887,063
Revenue (in 000’s). . . . . . . . . . . . . . . . . . . . . . . . . . . . . $2,092,251 $2,026,910 $2,128,859
Average monthly residential revenue per
customer(1) . . . . . . . . . . . . . . . . . . . . . . . . . . . . . . . . . . $ 61.11 $ 59.23 $ 58.33
Customer monthly churn . . . . . . . . . . . . . . . . . . . . . . . 1.73% 1.69% 1.62%
Business Customer Metrics:
Customers. . . . . . . . . . . . . . . . . . . . . . . . . . . . . . . . . . . . . 304,736 270,799 286,106
Revenue (in 000’s). . . . . . . . . . . . . . . . . . . . . . . . . . . . . $2,160,413 $2,183,025 $2,276,119
Average monthly business revenue per
customer . . . . . . . . . . . . . . . . . . . . . . . . . . . . . . . . . . . . $ 661.15 $ 654.04 $ 639.13
Total customers. . . . . . . . . . . . . . . . . . . . . . . . . . . . . . . . . . 3,519,572 3,074,280 3,173,169
Broadband subscribers . . . . . . . . . . . . . . . . . . . . . . . . . . . 2,373,893 1,866,670 1,754,422
Video subscribers . . . . . . . . . . . . . . . . . . . . . . . . . . . . . . . . 586,616 385,353 346,627
(1) Calculation excludes the operations of Mohave Cellular Limited Partnership, which was sold as of
April 1, 2013.
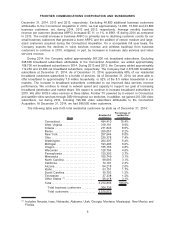
During 2014, we gained 445,300 customers, net, as compared to a loss of 98,900 customers, net,
in 2013 and a loss of 240,500 customers, net, in 2012. Excluding 526,900 customers attributable to the
Connecticut Acquisition, we lost 81,600 customers, net, in 2014. We believe the improved customer
retention in 2014 as compared to prior years is principally due to our investments in our network, our
local engagement strategy, improved customer service and simplified products and pricing.
Total residential revenue for 2014 increased $65 million, or 3%, as compared to 2013. Total
residential revenue for 2014 included $116 million attributable to the Connecticut operations. Total
residential revenue excluding the Connecticut operations declined $51 million, or 3%, as compared
with 2013, primarily as a result of decreases in voice services revenue and the sale of our interest in
the Mohave partnership, partially offset by increases in data services revenue. We had approximately
3,214,800, 2,803,500 and 2,887,100 total residential customers as of December 31, 2014, 2013 and
2012, respectively. Excluding 478,100 additional residential customers attributable to the Connecticut
Acquisition in 2014, we lost approximately 66,800, 83,600 and 216,700 residential customers, net,
during 2014, 2013 and 2012, respectively, principally driven by declines in voice customers. Our
residential customer monthly churn was 1.73%, 1.69% and 1.62% for 2014, 2013 and 2012,
respectively. Average monthly residential revenue per customer (residential ARPC) increased $1.88, or
3%, to $61.11 during 2014 as compared to 2013. The overall increase in residential ARPC is due to a
higher percentage of the Company’s residential customers that subscribe to broadband services and
Frontier Secure products, broadband customer migration to higher speeds and increases in our video
services. The Company expects continuing increases in residential data services revenue, primarily
driven by increased broadband subscribers, increases in video services and increases in voice
services revenue, primarily from the full year impact of the Connecticut operations.
Total business revenue for 2014 decreased $23 million, or 1%, as compared to 2013. Total
business revenue for 2014 included $90 million attributable to the Connecticut operations. Total
business revenue excluding the Connecticut operations declined $113 million, or 5%, as compared
with 2013, principally as a result of decreases in our voice services revenue and wireless backhaul
revenue. We had approximately 304,700, 270,800 and 286,100 total business customers as of
8
FRONTIER COMMUNICATIONS CORPORATION AND SUBSIDIARIES