Frontier Communications 2014 Annual Report Download - page 101
Download and view the complete annual report
Please find page 101 of the 2014 Frontier Communications annual report below. You can navigate through the pages in the report by either clicking on the pages listed below, or by using the keyword search tool below to find specific information within the annual report.-
 1
1 -
2
-
3
-
4
-
5
-
6
-
7
-
8
-
9
-
10
-
11
-
12
-
13
-
14
-
15
-
16
-
17
-
18
-
19
-
20
-
21
-
22
-
23
-
24
-
25
-
26
-
27
-
28
-
29
-
30
-
31
-
32
-
33
-
34
-
35
-
36
-
37
-
38
-
39
-
40
-
41
-
42
-
43
-
44
-
45
-
46
-
47
-
48
-
49
-
50
-
51
-
52
-
53
-
54
-
55
-
56
-
57
-
58
-
59
-
60
-
61
-
62
-
63
-
64
-
65
-
66
-
67
-
68
-
69
-
70
-
71
-
72
-
73
-
74
-
75
-
76
-
77
-
78
-
79
-
80
-
81
-
82
-
83
-
84
-
85
-
86
-
87
-
88
-
89
-
90
-
 91
91 -
 92
92 -
 93
93 -
 94
94 -
 95
95 -
 96
96 -
 97
97 -
 98
98 -
 99
99 -
 100
100 -
 101
101 -
 102
102 -
 103
103 -
 104
104 -
 105
105 -
 106
106 -
 107
107 -
 108
108
 |
 |

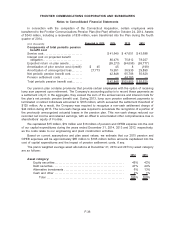
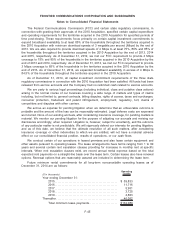
The amounts recognized as a component of accumulated comprehensive loss for the years ended
December 31, 2014 and 2013 are as follows:
($ in thousands) 2014 2013 2014 2013
Pension Plan OPEB
Accumulated other comprehensive loss at
beginning of year . . . . . . . . . . . . . . . . . . . . . . . . $411,432 $ 697,874 $ 5,230 $ 74,264
Net actuarial gain (loss) recognized during
year . . . . . . . . . . . . . . . . . . . . . . . . . . . . . . . . . . . . (19,951) (36,930) (2,916) (7,846)
Prior service (cost) credit recognized during
year . . . . . . . . . . . . . . . . . . . . . . . . . . . . . . . . . . . . (45) (8) 3,911 6,101
Net actuarial loss (gain) occurring during
year . . . . . . . . . . . . . . . . . . . . . . . . . . . . . . . . . . . . 140,832 (205,341) 112,525 (67,289)
Settlement costs recognized during year . . . . — (44,163) — —
Net amount recognized in comprehensive
income (loss) for the year. . . . . . . . . . . . . . . . 120,836 (286,442) 113,520 (69,034)
Accumulated other comprehensive loss at
end of year . . . . . . . . . . . . . . . . . . . . . . . . . . . . . $532,268 $ 411,432 $118,750 $ 5,230
401(k) Savings Plans
We sponsor employee retirement savings plans under section 401(k) of the Internal Revenue
Code. The plans cover substantially all full-time employees. Under certain plans, we provide matching
contributions. Employer contributions were $21 million, $21 million and $23 million for 2014, 2013 and
2012, respectively.
(17) Fair Value of Financial Instruments:
Fair value is defined under U.S. GAAP as the exit price associated with the sale of an asset or
transfer of a liability in an orderly transaction between market participants at the measurement date.
Valuation techniques used to measure fair value under U.S. GAAP must maximize the use of
observable inputs and minimize the use of unobservable inputs. In addition, U.S. GAAP establishes a
three-tier fair value hierarchy, which prioritizes the inputs used in measuring fair value.
The three input levels in the hierarchy of fair value measurements are defined by the FASB
generally as follows:
Input
Level Description of Input
Level 1 Observable inputs such as quoted prices in active markets for identical assets.
Level 2 Inputs other than quoted prices in active markets that are either directly or indirectly
observable.
Level 3 Unobservable inputs in which little or no market data exists.
F-40
FRONTIER COMMUNICATIONS CORPORATION AND SUBSIDIARIES
Notes to Consolidated Financial Statements