Frontier Communications 2014 Annual Report Download - page 42
Download and view the complete annual report
Please find page 42 of the 2014 Frontier Communications annual report below. You can navigate through the pages in the report by either clicking on the pages listed below, or by using the keyword search tool below to find specific information within the annual report.-
 1
1 -
2
-
3
-
4
-
5
-
6
-
7
-
8
-
9
-
10
-
11
-
12
-
13
-
14
-
15
-
16
-
17
-
18
-
19
-
20
-
21
-
22
-
23
-
24
-
25
-
26
-
27
-
28
-
29
-
30
-
31
-
 32
32 -
 33
33 -
 34
34 -
 35
35 -
 36
36 -
 37
37 -
 38
38 -
 39
39 -
 40
40 -
 41
41 -
 42
42 -
 43
43 -
 44
44 -
 45
45 -
 46
46 -
 47
47 -
 48
48 -
 49
49 -
 50
50 -
 51
51 -
 52
52 -
53
-
54
-
55
-
56
-
57
-
58
-
59
-
60
-
61
-
62
-
63
-
64
-
65
-
66
-
67
-
68
-
69
-
70
-
71
-
72
-
73
-
74
-
75
-
76
-
77
-
78
-
79
-
80
-
81
-
82
-
83
-
84
-
85
-
86
-
87
-
88
-
89
-
90
-
91
-
92
-
93
-
94
-
95
-
96
-
97
-
98
-
99
-
100
-
101
-
102
-
103
-
104
-
105
-
106
-
107
-
108
 |
 |
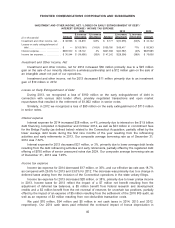
accordance with the Tax Increase Prevention Act of 2014. Absent any legislative changes in 2015, we
expect that our cash tax payments will be in the range of approximately $175 million to $200 million for
2015.
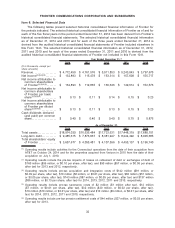
Net income attributable to common shareholders of Frontier
Net income attributable to common shareholders of Frontier for 2014 was $133 million, or $0.13
per share, as compared to $113 million, or $0.11 per share, in 2013 and $137 million, or $0.14 per
share, in 2012.
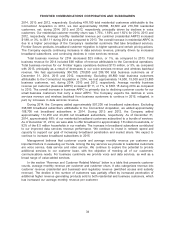
(b) Liquidity and Capital Resources
Analysis of Cash Flows
As of December 31, 2014, we had cash and cash equivalents aggregating $682 million. Our
primary source of funds continued to be cash generated from operations. In 2014, we used cash flow
from operations, cash on hand and debt issuance proceeds to principally fund all of our cash investing
and financing activities, primarily the Connecticut Acquisition, capital expenditures, dividends and debt
repayments.
As discussed below, on September 17, 2014, the Company completed a registered debt offering
of $775 million aggregate principal amount of 6.250% senior unsecured notes due 2021, and
$775 million aggregate principal amount of 6.875% senior unsecured notes due 2025. The Company
used the net proceeds from the offering of the notes, together with borrowings of $350 million under
the 2014 CoBank Credit Agreement, as defined below, and cash on hand to finance the Connecticut
Acquisition, which closed on October 24, 2014.
At December 31, 2014, we had a working capital deficit of $26 million, as compared to a working
capital surplus of $317 million at December 31, 2013. The decline in working capital is primarily due to
a reduction in cash and cash equivalents of $198 million related to financing the Connecticut
Acquisition and an increase in current liabilities of $210 million.
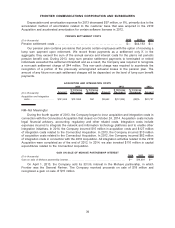
Cash Flows provided by Operating Activities
Cash flows provided by operating activities declined $226 million, or 15%, in 2014 as compared to
2013. The decrease was primarily the result of higher acquisition and integration costs and lower
adjusted net income before depreciation and amortization during 2014.
We paid $70 million in net cash taxes in 2014 as compared to $94 million and $5 million in net
cash taxes in 2013 and 2012, respectively. Our 2014 cash taxes paid reflected the continued impact of
bonus depreciation in accordance with the Tax Increase Prevention Act of 2014. Absent any legislative
changes in 2015, we expect that our cash tax payments will be in the range of approximately
$175 million to $200 million for 2015.
During 2013, the Company contributed four real estate properties with a fair value of $23 million to
its qualified defined benefit pension plan. The pension plan obtained independent appraisals of the
properties and, based on these appraisals, the pension plan recorded the contributions at their fair
value.
In connection with the Connecticut Acquisition, the Company recognized $142 million and
$10 million of acquisition and integration costs incurred in 2014 and 2013, respectively, and $23 million
and $1 million of interest expense in 2014 and 2013, respectively, related to the Bridge Facility (as
defined below). The Company currently expects that it will incur approximately $450 million of
operating expenses and capital expenditures in total related to acquisition and integration activities in
2015 and 2016 associated with the Verizon Transaction.
41
FRONTIER COMMUNICATIONS CORPORATION AND SUBSIDIARIES