Frontier Communications 2014 Annual Report Download - page 35
Download and view the complete annual report
Please find page 35 of the 2014 Frontier Communications annual report below. You can navigate through the pages in the report by either clicking on the pages listed below, or by using the keyword search tool below to find specific information within the annual report.-
 1
1 -
2
-
3
-
4
-
5
-
6
-
7
-
8
-
9
-
10
-
11
-
12
-
13
-
14
-
15
-
16
-
17
-
18
-
19
-
20
-
21
-
22
-
23
-
24
-
 25
25 -
 26
26 -
 27
27 -
 28
28 -
 29
29 -
 30
30 -
 31
31 -
 32
32 -
 33
33 -
 34
34 -
 35
35 -
 36
36 -
 37
37 -
 38
38 -
 39
39 -
 40
40 -
 41
41 -
 42
42 -
 43
43 -
 44
44 -
 45
45 -
46
-
47
-
48
-
49
-
50
-
51
-
52
-
53
-
54
-
55
-
56
-
57
-
58
-
59
-
60
-
61
-
62
-
63
-
64
-
65
-
66
-
67
-
68
-
69
-
70
-
71
-
72
-
73
-
74
-
75
-
76
-
77
-
78
-
79
-
80
-
81
-
82
-
83
-
84
-
85
-
86
-
87
-
88
-
89
-
90
-
91
-
92
-
93
-
94
-
95
-
96
-
97
-
98
-
99
-
100
-
101
-
102
-
103
-
104
-
105
-
106
-
107
-
108
 |
 |
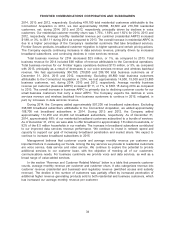
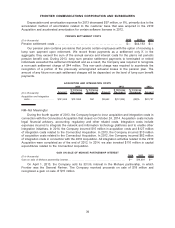
2014, 2013 and 2012, respectively. Excluding 478,100 total residential customers attributable to the
Connecticut Acquisition in 2014, we lost approximately 66,800, 83,600 and 216,700 residential
customers, net, during 2014, 2013 and 2012, respectively, principally driven by declines in voice
customers. Our residential customer monthly churn was 1.73%, 1.69% and 1.62% for 2014, 2013 and
2012, respectively. Average monthly residential revenue per customer (residential ARPC) increased
$1.88, or 3%, to $61.11 during 2014 as compared to 2013. The overall increase in residential ARPC is
due to a higher percentage of the Company’s residential customers that take broadband services,
Frontier Secure products, broadband customer migration to higher speeds and certain pricing actions.
The Company expects continuing increases in data services revenue, primarily driven by increased
broadband subscribers, and continuing declines in voice services revenue.
Total business revenue for 2014 decreased $23 million, or 1%, as compared to 2013. Total
business revenue for 2014 included $90 million of revenue attributable to the Connecticut operations.
Total business revenue for our Frontier legacy operations declined $113 million, or 5%, as compared
with 2013, principally as a result of decreases in our voice services revenue and wireless backhaul
revenue. We had approximately 304,700, 270,800 and 286,100 total business customers as of
December 31, 2014, 2013 and 2012, respectively. Excluding 48,800 total business customers
attributable to the Connecticut Acquisition in 2014, we lost approximately 14,900, 15,300 and 23,800
business customers, net, during 2014, 2013 and 2012, respectively. Average monthly business
revenue per customer (business ARPC) increased $7.11, or 1%, to $661.15 during 2014 as compared
to 2013. The overall increase in business ARPC is primarily due to declining customer counts for our
small business customers that carry a lower ARPC. The Company expects the declines in voice
services revenue and wireless backhaul from business customers to continue in 2015, mitigated, in
part, by increases in data services revenue.
During 2014, the Company added approximately 507,200 net broadband subscribers. Excluding
398,600 broadband subscribers attributable to the Connecticut Acquisition, we added approximately
108,700 net broadband subscribers in 2014. During 2013 and 2012, the Company added
approximately 112,250 and 23,400 net broadband subscribers, respectively. As of December 31,
2014, approximately 68% of our residential broadband customers subscribed to a bundle of services.
As of December 31, 2014, we were able to offer broadband to approximately 7.8 million households, or
92% of the 8.5 million households in our markets. The increase in broadband subscribers contributed
to our improved data services revenue performance. We continue to invest in network speed and
capacity to support our goal of increasing broadband penetration and market share. We expect to
continue to increase broadband subscribers in 2015.
Management believes that customer counts and average monthly revenue per customer are
important factors in evaluating our trends. Among the key services we provide to residential customers
are voice service, data service and video service. We continue to explore the potential to provide
additional services to our customer base, with the objective of meeting all of our customers’
communications needs. For business customers we provide voice and data services, as well as a
broad range of value-added services.
In the section “Revenue and Customer Related Metrics” below is a table that presents customer
counts, average monthly revenue per customer and customer churn. It also categorizes revenue into
customer revenue (residential and business) and regulatory revenue (switched access and subsidy
revenue). The decline in the number of customers was partially offset by increased penetration of
additional higher revenue generating products sold to both residential and business customers, which
has increased our average monthly revenue per customer.
34
FRONTIER COMMUNICATIONS CORPORATION AND SUBSIDIARIES