Frontier Communications 2014 Annual Report Download - page 38
Download and view the complete annual report
Please find page 38 of the 2014 Frontier Communications annual report below. You can navigate through the pages in the report by either clicking on the pages listed below, or by using the keyword search tool below to find specific information within the annual report.-
 1
1 -
2
-
3
-
4
-
5
-
6
-
7
-
8
-
9
-
10
-
11
-
12
-
13
-
14
-
15
-
16
-
17
-
18
-
19
-
20
-
21
-
22
-
23
-
24
-
25
-
26
-
27
-
 28
28 -
 29
29 -
 30
30 -
 31
31 -
 32
32 -
 33
33 -
 34
34 -
 35
35 -
 36
36 -
 37
37 -
 38
38 -
 39
39 -
 40
40 -
 41
41 -
 42
42 -
 43
43 -
 44
44 -
 45
45 -
 46
46 -
 47
47 -
 48
48 -
49
-
50
-
51
-
52
-
53
-
54
-
55
-
56
-
57
-
58
-
59
-
60
-
61
-
62
-
63
-
64
-
65
-
66
-
67
-
68
-
69
-
70
-
71
-
72
-
73
-
74
-
75
-
76
-
77
-
78
-
79
-
80
-
81
-
82
-
83
-
84
-
85
-
86
-
87
-
88
-
89
-
90
-
91
-
92
-
93
-
94
-
95
-
96
-
97
-
98
-
99
-
100
-
101
-
102
-
103
-
104
-
105
-
106
-
107
-
108
 |
 |

switched access revenues also included the impact of disputes with carriers and customer credits. The
2011 Order provided for the gradual elimination of terminating traffic charges by 2017. We have been
able to recover a significant portion of these lost revenues through end user rates and other
replacement support mechanisms, a trend we expect will continue through 2015.
Switched access and subsidy revenue for 2013 decreased $55 million, or 9%, as compared with
2012. Switched access revenue accounted for $48 million, or 17%, of this decrease, primarily due to
the impact of a decline in minutes of use related to access line losses and the displacement of minutes
of use by wireless, email and other communications services combined with a reduction due to the
impact of the lower rates enacted by the FCC’s intercarrier compensation reform. These decreases in
switched access revenues were partially offset by the impact of disputes with carriers and lower
customer credits. Subsidy revenues decreased $8 million, or 2%, primarily due to the lower
contribution factor for end user USF in 2013.
The FCC has announced its CAF II model development and CAF II funding could be implemented
during 2015. We cannot determine whether we will accept or refuse any funding under the CAF Phase
II support programs until all obligations associated with the funding have been determined.
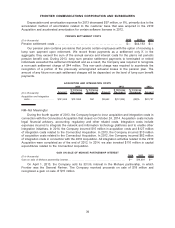
OPERATING EXPENSES
NETWORK ACCESS EXPENSES
2014 2013 2012
($ in thousands)
Consolidated
Amount
Connecticut
Operations Amount
$ Increase
(Decrease)
% Increase
(Decrease) Amount
$ Increase
(Decrease)
% Increase
(Decrease) Amount
Frontier Legacy
Network access
expenses. . . . $465,395 $38,570 $426,825 $(4,248) (1)% $431,073 $(10,515) (2)% $441,588
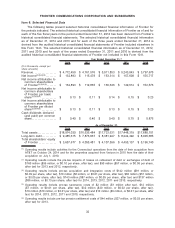
Network access expenses include access charges and other third-party costs directly attributable
to providing access to customer locations from our network and video content costs. These costs
exclude network related expenses, depreciation and amortization, and employee related expenses.
Network access expenses for 2014 decreased $4 million, or 1%, primarily due to lower reciprocal
compensation costs that are recorded in network access expenses, partially offset by higher joint pole
rates and an increase in network access expenses related to higher broadband subscriber counts.
Network access expenses for 2013 decreased $11 million, or 2%, primarily due to lower long
distance carriage costs, reduced content costs related to fewer FiOSvideo service customers and a
reduction in costs for our originating traffic associated with the implementation of the 2011 Order
effective with the second half of 2012.
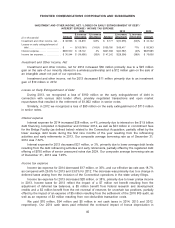
NETWORK RELATED EXPENSES
2014 2013 2012
($ in thousands)
Consolidated
Amount
Connecticut
Operations Amount
$ Increase
(Decrease)
% Increase
(Decrease) Amount
$ Increase
(Decrease)
% Increase
(Decrease) Amount
Frontier Legacy
Network related
expenses . . . . $1,118,427 $51,531 $1,066,896 $(16,659) (2)% $1,083,555 $(50,137) (4)% $1,133,692
Network related expenses include certain expenses associated with the delivery of services to
customers and the operation and maintenance of our network, such as facility rent, utilities,
maintenance and other costs, as well as salaries, wages and related benefits associated with
personnel who are responsible for the delivery of services, operation and maintenance of our network.
Network related expenses for 2014 decreased $17 million, or 2%, primarily due to lower allocated
costs for certain benefits, including pension and OPEB expense (as discussed below), and reduced
installation and repair costs, partially offset by increased fleet and facilities costs.
Network related expenses for 2013 decreased $50 million, or 4%, primarily due to the full year
impact from the elimination of redundant information technology costs associated with the completion
37
FRONTIER COMMUNICATIONS CORPORATION AND SUBSIDIARIES