Frontier Communications 2014 Annual Report Download - page 30
Download and view the complete annual report
Please find page 30 of the 2014 Frontier Communications annual report below. You can navigate through the pages in the report by either clicking on the pages listed below, or by using the keyword search tool below to find specific information within the annual report.-
 1
1 -
2
-
3
-
4
-
5
-
6
-
7
-
8
-
9
-
10
-
11
-
12
-
13
-
14
-
15
-
16
-
17
-
18
-
19
-
 20
20 -
 21
21 -
 22
22 -
 23
23 -
 24
24 -
 25
25 -
 26
26 -
 27
27 -
 28
28 -
 29
29 -
 30
30 -
 31
31 -
 32
32 -
 33
33 -
 34
34 -
 35
35 -
 36
36 -
 37
37 -
 38
38 -
 39
39 -
 40
40 -
41
-
42
-
43
-
44
-
45
-
46
-
47
-
48
-
49
-
50
-
51
-
52
-
53
-
54
-
55
-
56
-
57
-
58
-
59
-
60
-
61
-
62
-
63
-
64
-
65
-
66
-
67
-
68
-
69
-
70
-
71
-
72
-
73
-
74
-
75
-
76
-
77
-
78
-
79
-
80
-
81
-
82
-
83
-
84
-
85
-
86
-
87
-
88
-
89
-
90
-
91
-
92
-
93
-
94
-
95
-
96
-
97
-
98
-
99
-
100
-
101
-
102
-
103
-
104
-
105
-
106
-
107
-
108
 |
 |

Item 4. Mine Safety Disclosures
Not applicable.
PART II
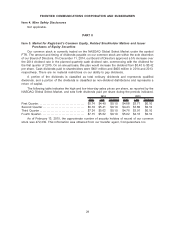
Item 5. Market for Registrant’s Common Equity, Related Stockholder Matters and Issuer
Purchases of Equity Securities
Our common stock is currently traded on the NASDAQ Global Select Market under the symbol
FTR. The amount and timing of dividends payable on our common stock are within the sole discretion
of our Board of Directors. On December 11, 2014, our Board of Directors approved a 5% increase over
the 2014 dividend rate in the planned quarterly cash dividend rate, commencing with the dividend for
the first quarter of 2015. On an annual basis, this plan would increase the dividend from $0.40 to $0.42
per share. Cash dividends paid to shareholders were $401 million and $400 million in 2014 and 2013,
respectively. There are no material restrictions on our ability to pay dividends.
A portion of the dividends is classified as total ordinary dividends and represents qualified
dividends, and a portion of the dividends is classified as non-dividend distributions and represents a
return of capital.
The following table indicates the high and low intra-day sales prices per share, as reported by the
NASDAQ Global Select Market, and sets forth dividends paid per share during the periods indicated.
High Low Dividend High Low Dividend
2014 2013
First Quarter . . . . . . . . . . . . . . . . . . . . . . . . . . . . . . . . . . $5.74 $4.40 $0.10 $4.68 $3.71 $0.10
Second Quarter . . . . . . . . . . . . . . . . . . . . . . . . . . . . . . . $6.10 $5.41 $0.10 $4.43 $3.80 $0.10
Third Quarter . . . . . . . . . . . . . . . . . . . . . . . . . . . . . . . . . $7.24 $5.62 $0.10 $4.76 $3.91 $0.10
Fourth Quarter . . . . . . . . . . . . . . . . . . . . . . . . . . . . . . . . $7.15 $5.62 $0.10 $5.02 $4.16 $0.10
As of February 13, 2015, the approximate number of security holders of record of our common
stock was 472,330. This information was obtained from our transfer agent, Computershare Inc.
29
FRONTIER COMMUNICATIONS CORPORATION AND SUBSIDIARIES