Frontier Communications 2014 Annual Report Download - page 34
Download and view the complete annual report
Please find page 34 of the 2014 Frontier Communications annual report below. You can navigate through the pages in the report by either clicking on the pages listed below, or by using the keyword search tool below to find specific information within the annual report.-
 1
1 -
2
-
3
-
4
-
5
-
6
-
7
-
8
-
9
-
10
-
11
-
12
-
13
-
14
-
15
-
16
-
17
-
18
-
19
-
20
-
21
-
22
-
23
-
 24
24 -
 25
25 -
 26
26 -
 27
27 -
 28
28 -
 29
29 -
 30
30 -
 31
31 -
 32
32 -
 33
33 -
 34
34 -
 35
35 -
 36
36 -
 37
37 -
 38
38 -
 39
39 -
 40
40 -
 41
41 -
 42
42 -
 43
43 -
 44
44 -
45
-
46
-
47
-
48
-
49
-
50
-
51
-
52
-
53
-
54
-
55
-
56
-
57
-
58
-
59
-
60
-
61
-
62
-
63
-
64
-
65
-
66
-
67
-
68
-
69
-
70
-
71
-
72
-
73
-
74
-
75
-
76
-
77
-
78
-
79
-
80
-
81
-
82
-
83
-
84
-
85
-
86
-
87
-
88
-
89
-
90
-
91
-
92
-
93
-
94
-
95
-
96
-
97
-
98
-
99
-
100
-
101
-
102
-
103
-
104
-
105
-
106
-
107
-
108
 |
 |
Item 7. Management’s Discussion and Analysis of Financial Condition and Results of
Operations
(a) Results of Operations
Effective October 24, 2014, the Company’s scope of operations and balance sheet capitalization
changed materially as a result of the completion of the Connecticut Acquisition. Historical financial and
operating data presented for Frontier is not indicative of future results and includes the results of the
Connecticut operations that were acquired in the Connecticut Acquisition from the date of acquisition
on October 24, 2014. The financial discussion below includes a comparative analysis of our results of
operations on a historical basis for our Frontier operations as of and for the years ended December 31,
2014, 2013 and 2012. Unless otherwise noted, the variance explanations discussed below are based
upon an analysis of the 2014 financial data for Frontier legacy operations (excluding the Connecticut
operations) in comparison to 2013.
Prior period amounts for other operating expenses have been revised from the previously
disclosed amounts to reflect the disaggregation of other operating expenses into network related
expenses and selling, general and administrative expenses. There has been no change to total
operating expense as a result of this reclassification.
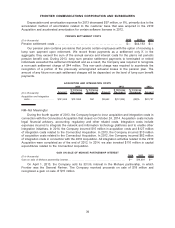
REVENUE
Revenue is generated primarily through the provision of voice services, data services, video
services, network access, carrier services and other Internet services. Such revenues are generated
through either a monthly recurring fee or a fee based on usage, and revenue recognition is not
dependent upon significant judgments by management, with the exception of a determination of a
provision for uncollectible amounts.
Revenue for 2014 increased $11 million to $4,772 million as compared to 2013. Excluding
additional revenue of $216 million attributable to the Connecticut operations, our revenue for 2014
decreased $205 million, or 4%, as compared to 2013. This decline in 2014 is primarily the result of
decreases in voice services revenues and lower switched and nonswitched access revenue, partially
offset by an increase in data services revenue, each as described in more detail below.
Total company switched access and subsidy revenue of $520 million represented 11% of our
revenues for 2014. Switched access revenue was $201 million in 2014, or 4% of our revenues, down
from $235 million, or 5% of our revenues, in 2013. Subsidy revenue was $319 million in 2014, or 7% of
our revenues, which increased slightly from $317 million, or 7% of our revenues, in 2013. We expect
declining revenue trends in switched access revenue to continue in 2015.
Revenue for 2013 decreased $250 million, or 5%, to $4,762 million as compared to 2012. The
decline in 2013 was primarily the result of decreases in voice revenues and lower switched and
nonswitched access revenue, partially offset by an increase in data services revenue, each as
described in more detail below. Additionally, wireless revenue decreased by $32 million in 2013 due to
the sale of our Mohave Cellular Limited Partnership (Mohave) interest on April 1, 2013.
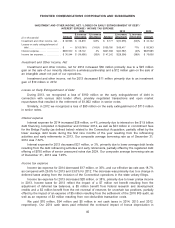
During 2014, we gained 445,300 customers, net, as compared to a loss of 98,900 customers, net,
in 2013 and a loss of 240,500 customers, net, in 2012. Excluding 526,900 customers attributable to the
Connecticut Acquisition, we lost 81,600 customers, net, in 2014. We believe the improved customer
retention in 2014 as compared to prior years is principally due to our investments in our network, our
local engagement strategy, improved customer service and simplified products and pricing.
Total residential revenue for 2014 increased $65 million, or 3%, as compared to 2013. Total
residential revenue for 2014 included $116 million of revenue attributable to the Connecticut
operations. Total residential revenue for our Frontier legacy operations declined $51 million, or 3%, as
compared with 2013, primarily as a result of decreases in voice services revenue and the sale of our
interest in the Mohave partnership, partially offset by increases in data services revenue. We had
approximately 3,214,800, 2,803,500 and 2,887,100 total residential customers as of December 31,
33
FRONTIER COMMUNICATIONS CORPORATION AND SUBSIDIARIES