Frontier Communications 2014 Annual Report Download - page 10
Download and view the complete annual report
Please find page 10 of the 2014 Frontier Communications annual report below. You can navigate through the pages in the report by either clicking on the pages listed below, or by using the keyword search tool below to find specific information within the annual report.-
 1
1 -
 2
2 -
 3
3 -
 4
4 -
 5
5 -
 6
6 -
 7
7 -
 8
8 -
 9
9 -
 10
10 -
 11
11 -
 12
12 -
 13
13 -
 14
14 -
 15
15 -
 16
16 -
 17
17 -
 18
18 -
 19
19 -
 20
20 -
 21
21 -
22
-
23
-
24
-
25
-
26
-
27
-
28
-
29
-
30
-
31
-
32
-
33
-
34
-
35
-
36
-
37
-
38
-
39
-
40
-
41
-
42
-
43
-
44
-
45
-
46
-
47
-
48
-
49
-
50
-
51
-
52
-
53
-
54
-
55
-
56
-
57
-
58
-
59
-
60
-
61
-
62
-
63
-
64
-
65
-
66
-
67
-
68
-
69
-
70
-
71
-
72
-
73
-
74
-
75
-
76
-
77
-
78
-
79
-
80
-
81
-
82
-
83
-
84
-
85
-
86
-
87
-
88
-
89
-
90
-
91
-
92
-
93
-
94
-
95
-
96
-
97
-
98
-
99
-
100
-
101
-
102
-
103
-
104
-
105
-
106
-
107
-
108
 |
 |

December 31, 2014, 2013 and 2012, respectively. Excluding 48,800 additional business customers
attributable to the Connecticut Acquisition in 2014, we lost approximately 14,900, 15,300 and 23,800
business customers, net, during 2014, 2013 and 2012, respectively. Average monthly business
revenue per customer (business ARPC) increased $7.11, or 1%, to $661.15 during 2014 as compared
to 2013. The overall increase in business ARPC is primarily due to declining customer counts for our
small business customers that generate a lower ARPC and the addition of certain medium and large-
sized customers acquired during the Connecticut Acquisition. On a comparable full year basis, the
Company expects the declines in voice services revenue and wireless backhaul from business
customers to continue in 2015, mitigated, in part, by increases in business data services and video
services revenue.
During 2014, the Company added approximately 507,200 net broadband subscribers. Excluding
398,600 broadband subscribers attributable to the Connecticut Acquisition, we added approximately
108,700 net broadband subscribers in 2014. During 2013 and 2012, the Company added approximately
112,250 and 23,400 net broadband subscribers, respectively. The Company had 2,373,900 broadband
subscribers at December 31, 2014. As of December 31, 2014, approximately 68% of our residential
broadband customers subscribed to a bundle of services. As of December 31, 2014, we were able to
offer broadband to approximately 7.8 million households, or 92% of the 8.5 million households in our
markets. The increase in broadband subscribers contributed to our improved data services revenue
performance. We continue to invest in network speed and capacity to support our goal of increasing
broadband penetration and market share. We expect to continue to increase broadband subscribers in
2015. We offer FiOSvideo services in three states, Frontier TV powered by U-versein Connecticut
and satellite video services through DISH throughout our territories. In addition, we gained 201,300 video
subscribers, net during 2014, including 196,400 video subscribers attributable to the Connecticut
Acquisition. At December 31, 2014, we had 586,600 video customers.
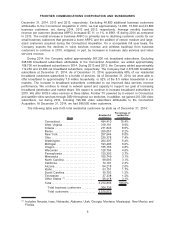
The following table sets forth total residential customers by state as of December 31, 2014:
State
Residential
customers
Percentage of
residential
customers
Connecticut. . . . . . . . . . . . . . . . . . . . . . . . . . 494,410 15.4%
West Virginia . . . . . . . . . . . . . . . . . . . . . . . . 319,191 9.9%
Indiana . . . . . . . . . . . . . . . . . . . . . . . . . . . . . . 271,843 8.5%
Illinois . . . . . . . . . . . . . . . . . . . . . . . . . . . . . . . 265,057 8.2%
New York. . . . . . . . . . . . . . . . . . . . . . . . . . . . 257,944 8.0%
Ohio . . . . . . . . . . . . . . . . . . . . . . . . . . . . . . . . 239,378 7.4%
Washington. . . . . . . . . . . . . . . . . . . . . . . . . . 204,307 6.4%
Michigan . . . . . . . . . . . . . . . . . . . . . . . . . . . . 193,496 6.0%
Oregon . . . . . . . . . . . . . . . . . . . . . . . . . . . . . . 155,163 4.8%
Wisconsin . . . . . . . . . . . . . . . . . . . . . . . . . . . 128,794 4.0%
Pennsylvania . . . . . . . . . . . . . . . . . . . . . . . . 120,393 3.7%
Minnesota . . . . . . . . . . . . . . . . . . . . . . . . . . . 100,749 3.1%
North Carolina . . . . . . . . . . . . . . . . . . . . . . . 99,093 3.1%
California . . . . . . . . . . . . . . . . . . . . . . . . . . . . 74,101 2.3%
Arizona. . . . . . . . . . . . . . . . . . . . . . . . . . . . . . 64,218 2.0%
Idaho. . . . . . . . . . . . . . . . . . . . . . . . . . . . . . . . 53,151 1.7%
South Carolina. . . . . . . . . . . . . . . . . . . . . . . 39,792 1.2%
Tennessee . . . . . . . . . . . . . . . . . . . . . . . . . . 37,338 1.2%
Other States (1) . . . . . . . . . . . . . . . . . . . . . . 96,418 3.1%
Total . . . . . . . . . . . . . . . . . . . . . . . . . . . . . . . . 3,214,836 100.0%
Total business customers . . . . . . . . . . 304,736
Total customers . . . . . . . . . . . . . . . . . . . 3,519,572
(1) Includes Nevada, Iowa, Nebraska, Alabama, Utah, Georgia, Montana, Mississippi, New Mexico and
Florida.
9
FRONTIER COMMUNICATIONS CORPORATION AND SUBSIDIARIES