Frontier Communications 2014 Annual Report Download - page 70
Download and view the complete annual report
Please find page 70 of the 2014 Frontier Communications annual report below. You can navigate through the pages in the report by either clicking on the pages listed below, or by using the keyword search tool below to find specific information within the annual report.-
 1
1 -
2
-
3
-
4
-
5
-
6
-
7
-
8
-
9
-
10
-
11
-
12
-
13
-
14
-
15
-
16
-
17
-
18
-
19
-
20
-
21
-
22
-
23
-
24
-
25
-
26
-
27
-
28
-
29
-
30
-
31
-
32
-
33
-
34
-
35
-
36
-
37
-
38
-
39
-
40
-
41
-
42
-
43
-
44
-
45
-
46
-
47
-
48
-
49
-
50
-
51
-
52
-
53
-
54
-
55
-
56
-
57
-
58
-
59
-
 60
60 -
 61
61 -
 62
62 -
 63
63 -
 64
64 -
 65
65 -
 66
66 -
 67
67 -
 68
68 -
 69
69 -
 70
70 -
 71
71 -
 72
72 -
 73
73 -
 74
74 -
 75
75 -
 76
76 -
 77
77 -
 78
78 -
 79
79 -
 80
80 -
81
-
82
-
83
-
84
-
85
-
86
-
87
-
88
-
89
-
90
-
91
-
92
-
93
-
94
-
95
-
96
-
97
-
98
-
99
-
100
-
101
-
102
-
103
-
104
-
105
-
106
-
107
-
108
 |
 |

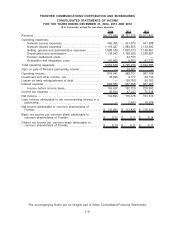
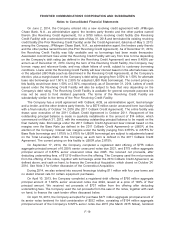
FRONTIER COMMUNICATIONS CORPORATION AND SUBSIDIARIES
CONSOLIDATED STATEMENTS OF CASH FLOWS
FOR THE YEARS ENDED DECEMBER 31, 2014, 2013 AND 2012
($ in thousands)
2014 2013 2012
Cash flows provided by (used in) operating activities:
Net income .............................................................. $ 132,893 $ 115,478 $ 153,314
Adjustments to reconcile net income to net cash provided by
operating activities:
Depreciation and amortization . ....................................... 1,138,942 1,169,500 1,266,807
Losses on early extinguishment of debt . . ............................. — 159,780 90,363
Pension settlement costs . . ........................................... — 44,163 —
Pension/OPEB costs . ................................................ (18,026) 37,243 28,087
Stock based compensation expense .................................. 23,462 16,932 16,775
Gains on sale of assets . . . ........................................... (37,041) (14,601) —
Other non-cash adjustments . . . ....................................... 32,129 11,065 10,319
Deferred income taxes ............................................... (77,876) (7,510) 80,501
Change in accounts receivable ....................................... (61,528) 50,487 43,813
Change in accounts payable and other liabilities . . . .................... 89,666 (6,507) (148,906)
Change in prepaid expenses, income taxes and other current assets . . . 47,451 (80,403) 11,400
Net cash provided by operating activities .................................. 1,270,072 1,495,627 1,552,473
Cash flows provided from (used by) investing activities:
Cash paid for the Connecticut Acquisition ............................. (2,017,787) — —
Capital expenditures—Business operations . . . ......................... (572,443) (634,685) (748,407)
Capital expenditures—Integration activities . . . ......................... (115,653) — (54,097)
Network expansion funded by Connect America Fund . . ............... (56,453) (32,748) (4,830)
Grant funds received for network expansion from Connect America
Fund .............................................................. 3,748 63,636 65,981
Proceeds on sale of assets........................................... 38,636 17,755 —
Cash transferred from escrow . ....................................... 11,411 31,249 102,020
Other. . .............................................................. 32,820 12,300 4,394
Net cash used by investing activities ...................................... (2,675,721) (542,493) (634,939)
Cash flows provided from (used by) financing activities:
Long-term debt borrowings ........................................... 1,911,125 750,000 1,360,625
Financing costs paid . ................................................ (40,496) (19,360) (27,852)
Long-term debt payments . ........................................... (259,935) (1,563,022) (756,953)
Premium paid to retire debt........................................... — (159,429) (72,290)
Dividends paid . . ..................................................... (400,892) (399,768) (399,390)
Other. . .............................................................. (2,058) (8,048) (21,236)
Net cash provided from (used by) financing activities. . . .................... 1,207,744 (1,399,627) 82,904
(Decrease)/Increase in cash and cash equivalents ......................... (197,905) (446,493) 1,000,438
Cash and cash equivalents at January 1,.................................. 880,039 1,326,532 326,094
Cash and cash equivalents at December 31, . ............................. $ 682,134 $ 880,039 $1,326,532
Supplemental cash flow information:
Cash paid during the period for:
Interest .............................................................. $ 655,531 $ 667,753 $ 636,485
Income taxes, net .................................................... $ 70,390 $ 94,161 $ 4,715
Non-cash investing and financing activities:
Capital lease obligations. . . ........................................... $ — $ — $ 26,596
Financing obligation for contributions of real property to pension plan. . . $ — $ 23,422 $ —
Reduction of pension obligation ....................................... $ — $ (23,422) $ —
Increase (decrease) in capital expenditures due to changes in accounts
payable. . . ......................................................... $ (15,271) $ 39,847 $ 9,802
The accompanying Notes are an integral part of these Consolidated Financial Statements
F-9