Frontier Communications 2014 Annual Report Download - page 66
Download and view the complete annual report
Please find page 66 of the 2014 Frontier Communications annual report below. You can navigate through the pages in the report by either clicking on the pages listed below, or by using the keyword search tool below to find specific information within the annual report.-
 1
1 -
2
-
3
-
4
-
5
-
6
-
7
-
8
-
9
-
10
-
11
-
12
-
13
-
14
-
15
-
16
-
17
-
18
-
19
-
20
-
21
-
22
-
23
-
24
-
25
-
26
-
27
-
28
-
29
-
30
-
31
-
32
-
33
-
34
-
35
-
36
-
37
-
38
-
39
-
40
-
41
-
42
-
43
-
44
-
45
-
46
-
47
-
48
-
49
-
50
-
51
-
52
-
53
-
54
-
55
-
 56
56 -
 57
57 -
 58
58 -
 59
59 -
 60
60 -
 61
61 -
 62
62 -
 63
63 -
 64
64 -
 65
65 -
 66
66 -
 67
67 -
 68
68 -
 69
69 -
 70
70 -
 71
71 -
 72
72 -
 73
73 -
 74
74 -
 75
75 -
 76
76 -
77
-
78
-
79
-
80
-
81
-
82
-
83
-
84
-
85
-
86
-
87
-
88
-
89
-
90
-
91
-
92
-
93
-
94
-
95
-
96
-
97
-
98
-
99
-
100
-
101
-
102
-
103
-
104
-
105
-
106
-
107
-
108
 |
 |

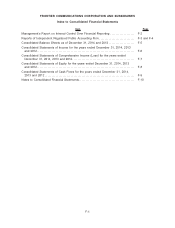
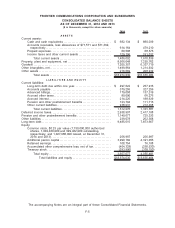
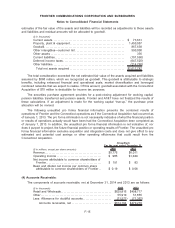
FRONTIER COMMUNICATIONS CORPORATION AND SUBSIDIARIES
CONSOLIDATED BALANCE SHEETS
AS OF DECEMBER 31, 2014 AND 2013
($ in thousands, except for share amounts)
2014 2013
ASSETS
Current assets:
Cash and cash equivalents . . . . . . . . . . . . . . . . . . . . . . . . . . . . . . . . . . . $ 682,134 $ 880,039
Accounts receivable, less allowances of $71,571 and $71,362,
respectively . . . . . . . . . . . . . . . . . . . . . . . . . . . . . . . . . . . . . . . . . . . . . . . . 614,164 479,210
Prepaid expenses . . . . . . . . . . . . . . . . . . . . . . . . . . . . . . . . . . . . . . . . . . . . 60,598 68,573
Income taxes and other current assets . . . . . . . . . . . . . . . . . . . . . . . . 129,196 191,017
Total current assets . . . . . . . . . . . . . . . . . . . . . . . . . . . . . . . . . . . . . . 1,486,092 1,618,839
Property, plant and equipment, net . . . . . . . . . . . . . . . . . . . . . . . . . . . . . . . . 8,566,048 7,255,762
Goodwill . . . . . . . . . . . . . . . . . . . . . . . . . . . . . . . . . . . . . . . . . . . . . . . . . . . . . . . . . 7,205,357 6,337,719
Other intangibles, net . . . . . . . . . . . . . . . . . . . . . . . . . . . . . . . . . . . . . . . . . . . . . 1,499,864 1,214,932
Other assets . . . . . . . . . . . . . . . . . . . . . . . . . . . . . . . . . . . . . . . . . . . . . . . . . . . . . 216,669 208,232
Total assets . . . . . . . . . . . . . . . . . . . . . . . . . . . . . . . . . . . . . . . . . . . . . $18,974,030 $16,635,484
LIABILITIES AND EQUITY
Current liabilities:
Long-term debt due within one year . . . . . . . . . . . . . . . . . . . . . . . . . . . $ 297,622 $ 257,916
Accounts payable . . . . . . . . . . . . . . . . . . . . . . . . . . . . . . . . . . . . . . . . . . . . 379,255 327,256
Advanced billings. . . . . . . . . . . . . . . . . . . . . . . . . . . . . . . . . . . . . . . . . . . . . 179,058 137,319
Accrued other taxes . . . . . . . . . . . . . . . . . . . . . . . . . . . . . . . . . . . . . . . . . . 80,090 66,276
Accrued interest. . . . . . . . . . . . . . . . . . . . . . . . . . . . . . . . . . . . . . . . . . . . . . 214,226 188,639
Pension and other postretirement benefits . . . . . . . . . . . . . . . . . . . . . 123,794 111,713
Other current liabilities. . . . . . . . . . . . . . . . . . . . . . . . . . . . . . . . . . . . . . . . 238,031 212,468
Total current liabilities . . . . . . . . . . . . . . . . . . . . . . . . . . . . . . . . . . . . 1,512,076 1,301,587
Deferred income taxes. . . . . . . . . . . . . . . . . . . . . . . . . . . . . . . . . . . . . . . . . . . . 2,938,907 2,417,108
Pension and other postretirement benefits . . . . . . . . . . . . . . . . . . . . . . . . . 1,140,677 725,333
Other liabilities . . . . . . . . . . . . . . . . . . . . . . . . . . . . . . . . . . . . . . . . . . . . . . . . . . . 239,078 262,308
Long-term debt . . . . . . . . . . . . . . . . . . . . . . . . . . . . . . . . . . . . . . . . . . . . . . . . . . . 9,485,615 7,873,667
Equity:
Common stock, $0.25 par value (1,750,000,000 authorized
shares, 1,002,469,000 and 999,462,000 outstanding,
respectively, and 1,027,986,000 issued, at December 31,
2014 and 2013) . . . . . . . . . . . . . . . . . . . . . . . . . . . . . . . . . . . . . . . . . . . . 256,997 256,997
Additional paid-in capital . . . . . . . . . . . . . . . . . . . . . . . . . . . . . . . . . . . . . . 3,990,160 4,321,056
Retained earnings . . . . . . . . . . . . . . . . . . . . . . . . . . . . . . . . . . . . . . . . . . . . 108,754 76,108
Accumulated other comprehensive loss, net of tax . . . . . . . . . . . . . (404,328) (260,530)
Treasury stock . . . . . . . . . . . . . . . . . . . . . . . . . . . . . . . . . . . . . . . . . . . . . . . (293,906) (338,150)
Total equity . . . . . . . . . . . . . . . . . . . . . . . . . . . . . . . . . . . . . . . . . . . . . . 3,657,677 4,055,481
Total liabilities and equity . . . . . . . . . . . . . . . . . . . . . . . . . . . . $18,974,030 $16,635,484
The accompanying Notes are an integral part of these Consolidated Financial Statements.
F-5