Frontier Communications 2010 Annual Report Download - page 98
Download and view the complete annual report
Please find page 98 of the 2010 Frontier Communications annual report below. You can navigate through the pages in the report by either clicking on the pages listed below, or by using the keyword search tool below to find specific information within the annual report.-
 1
1 -
2
-
3
-
4
-
5
-
6
-
7
-
8
-
9
-
10
-
11
-
12
-
13
-
14
-
15
-
16
-
17
-
18
-
19
-
20
-
21
-
22
-
23
-
24
-
25
-
26
-
27
-
28
-
29
-
30
-
31
-
32
-
33
-
34
-
35
-
36
-
37
-
38
-
39
-
40
-
41
-
42
-
43
-
44
-
45
-
46
-
47
-
48
-
49
-
50
-
51
-
52
-
53
-
54
-
55
-
56
-
57
-
58
-
59
-
60
-
61
-
62
-
63
-
64
-
65
-
66
-
67
-
68
-
69
-
70
-
71
-
72
-
73
-
74
-
75
-
76
-
77
-
78
-
79
-
80
-
81
-
82
-
83
-
84
-
85
-
86
-
87
-
 88
88 -
 89
89 -
 90
90 -
 91
91 -
 92
92 -
 93
93 -
 94
94 -
 95
95 -
 96
96 -
 97
97 -
 98
98 -
 99
99 -
 100
100 -
 101
101 -
 102
102 -
 103
103 -
 104
104
 |
 |

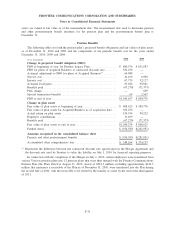
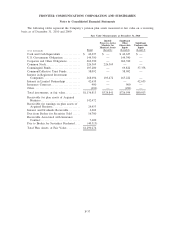
The following table provides further information regarding the redemption of the Plan’s Level 3
investments as of December 31, 2010:
($ in thousands)
Fair
Value
Redemption
Frequency
Redemption
Notice Period
Liquidation
Period
Commingled Funds
JPM Multi-Strat II C-A Ser 11-07 (a) . . . . . $37,378 Quarterly 65 Days NA
Interest in Limited Partnerships
Morgan Stanley Institutional Cayman
Fund LP (b) . . . . . . . . . . . . . . . . . . . . . . . . . . . 37,489 Quarterly 60 Days NA
RII World Timberfund, LLC (c). . . . . . . . . . . 5,146 Through liquidation of None 2 years
underlying investments
Total Interest in Limited Partnerships . . . . . . . . $42,635
(a) The fund’s investment objective is to generate long-term capital appreciation with relatively low volatility
and a low correlation with traditional equity and fixed-income markets. The fund seeks to accomplish this
objective by allocating its assets primarily among a select group of experienced portfolio managers that
invest in a variety of markets, either through the medium of investment funds or through discretionary
managed accounts.
(b) The partnership investment objective is to seek capital appreciation principally through investing in
investment funds managed by third party investment managers who employ a variety of alternative
investment strategies.
(c) The partnership’s objective is to realize substantial long-term capital appreciation by investing in
timberland properties primarily in South America, New Zealand and Australia.
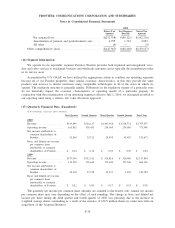
In January 2010, the FASB issued Accounting Standards Update (“ASU”) No. 2010-06, “Improving
Disclosures about Fair Value Measurements.” ASU No. 2010-06 requires entities to prepare new disclosures
surrounding amounts and reasons for significant transfers in and out of Level 1 and Level 2 fair value
measurements, as well as inputs and valuation techniques used to measure fair value for both recurring and
nonrecurring fair value measurements that fall in either Level 2 or Level 3, and information on purchases, sales,
issuances and settlements on a gross basis in the reconciliation of activity in Level 3 fair value measurements.
These new and revised disclosures are required to be implemented for fiscal years beginning after December
15, 2010. The adoption of the disclosure requirements of ASU No. 2010-06 in 2010 did not have a material
impact on our financial position, results of operations or cash flows.
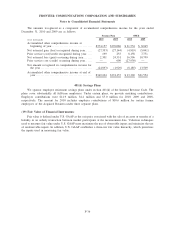
The fair value of our OPEB plan assets, which are measured using Level 1 inputs, was $6.2 million and
$8.0 million as of December 31, 2010 and 2009, respectively.
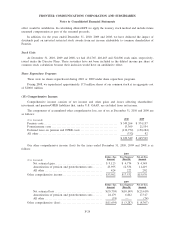
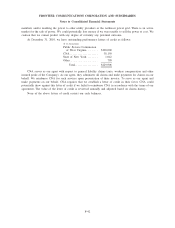
The following table summarizes the carrying amounts and estimated fair values for certain of our financial
instruments at December 31, 2010 and 2009. For the other financial instruments, representing cash, accounts
receivables, long-term debt due within one year, accounts payable and other accrued liabilities, the carrying
amounts approximate fair value due to the relatively short maturities of those instruments. Other equity method
investments, for which market values are not readily available, are carried at cost, which approximates fair
value.
($ in thousands)
Carrying
Amount Fair Value
Carrying
Amount Fair Value
2010 2009
Long-term debt . . . . . . . . . . . . . . . . . . . . . . . . . . . . . . . . . . . . . $7,983,693 $8,376,515 $4,794,129 $4,628,132
The fair value of our long-term debt is estimated based upon quoted market prices at the reporting date for
those financial instruments.
F-39
FRONTIER COMMUNICATIONS CORPORATION AND SUBSIDIARIES
Notes to Consolidated Financial Statements