Frontier Communications 2010 Annual Report Download - page 46
Download and view the complete annual report
Please find page 46 of the 2010 Frontier Communications annual report below. You can navigate through the pages in the report by either clicking on the pages listed below, or by using the keyword search tool below to find specific information within the annual report.-
 1
1 -
2
-
3
-
4
-
5
-
6
-
7
-
8
-
9
-
10
-
11
-
12
-
13
-
14
-
15
-
16
-
17
-
18
-
19
-
20
-
21
-
22
-
23
-
24
-
25
-
26
-
27
-
28
-
29
-
30
-
31
-
32
-
33
-
34
-
35
-
 36
36 -
 37
37 -
 38
38 -
 39
39 -
 40
40 -
 41
41 -
 42
42 -
 43
43 -
 44
44 -
 45
45 -
 46
46 -
 47
47 -
 48
48 -
 49
49 -
 50
50 -
 51
51 -
 52
52 -
 53
53 -
 54
54 -
 55
55 -
 56
56 -
57
-
58
-
59
-
60
-
61
-
62
-
63
-
64
-
65
-
66
-
67
-
68
-
69
-
70
-
71
-
72
-
73
-
74
-
75
-
76
-
77
-
78
-
79
-
80
-
81
-
82
-
83
-
84
-
85
-
86
-
87
-
88
-
89
-
90
-
91
-
92
-
93
-
94
-
95
-
96
-
97
-
98
-
99
-
100
-
101
-
102
-
103
-
104
 |
 |

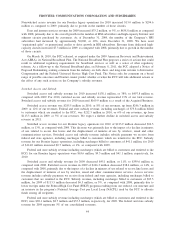
Federal subsidies are driven by many factors, including the NACPL. Many factors may lead to further
increases in the NACPL, thereby resulting in decreases in our federal subsidy revenue in the future. The FCC
and state regulatory agencies are currently considering a number of proposals for changing the manner in which
eligibility for subsidies is determined as well as the amounts of such subsidies. In addition, some of the reform
proposals direct additional support for broadband deployment which could create an opportunity for additional
federal subsidy support.
Certain states also have their own open proceedings to address reform to intrastate access charges and
other intercarrier compensation. In addition, we have been approached by, and/or are involved in formal state
proceedings with, various carriers seeking reductions in intrastate access rates in certain states. We cannot
predict when or how these matters will be decided or the effect on our subsidy or switched access revenues.
However, future reductions in our subsidy or switched access revenues will directly affect our profitability and
cash flows as those regulatory revenues do not have an equal level of associated variable expenses.
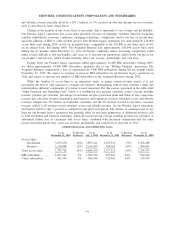
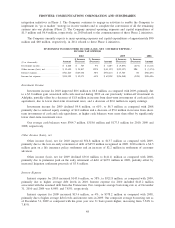
Directory Services
Directory services revenue for 2010 decreased $4.3 million, or 4%, to $102.8 million, as compared with
2009. Directory services revenue for 2010 increased $9.3 million as a result of the Acquired Business.
Directory services revenue for our Frontier legacy operations decreased $13.6 million, or 13%, as compared
with 2009, primarily due to a decline in yellow pages advertising.
Directory services revenue for 2009 decreased $6.3 million, or 6%, to $107.1 million as compared with
2008, primarily due to lower revenues from yellow pages local advertising.
Other
Other revenue for 2010 increased $98.9 million, or 152%, to $164.1 million, as compared with 2009.
Other revenue for 2010 increased $84.6 million as a result of the Acquired Business. Other revenue for our
Frontier legacy operations increased $14.3 million, or 22%, as compared with 2009, primarily due to reduced
DISH video credits and lower bad debt expenses that are charged against revenue, partially offset by decreases
in “bill and collect” fee revenue.
Other revenue for 2009 decreased $17.2 million, or 21%, to $65.2 million as compared with 2008,
primarily due to video promotional discounts of approximately $13.6 million.
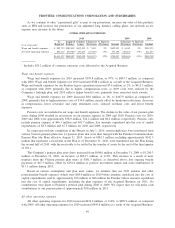
OPERATING EXPENSES
($ in thousands)
As
Reported
Acquired
Business
Frontier
Legacy
$ Increase
(Decrease)
% Increase
(Decrease) Amount
$ Increase
(Decrease)
% Increase
(Decrease) Amount
2010 2009 2008
Network access. . . . . . . . . . . . . $383,679 $173,533 $210,146 $(15,761) (7%) $225,907 $3,894 2% $222,013
Network access expenses for 2010 increased $157.8 million, or 70%, to $383.7 million, as compared with
2009. Network access expenses for 2010 increased $173.5 million as a result of the Acquired Business.
Network access expenses for our Frontier legacy operations decreased $15.8 million, or 7%, to $210.1 million,
as compared with 2009, primarily due to lower “aspirational gift” and long distance carriage costs in 2010. In
2009, we expensed $10.0 million for the cost of new personal computers provided to customers in connection
with our “Rolling Thunder” promotion which resulted in additional DISH video and HSI subscribers.
Network access expenses for 2009 increased $3.9 million, or 2%, to $225.9 million as compared to 2008
due to higher “aspirational gift” costs (e.g., personal computers), higher long distance carriage costs and
additional data backbone costs. During 2008, we expensed $4.2 million of promotional costs for Master Card
gift cards issued to new HSI customers entering into a two-year price protection plan and to existing customers
who purchased additional services under a two-year price protection plan and $3.0 million for a flat screen
television promotion.
45
FRONTIER COMMUNICATIONS CORPORATION AND SUBSIDIARIES