Frontier Communications 2010 Annual Report Download - page 49
Download and view the complete annual report
Please find page 49 of the 2010 Frontier Communications annual report below. You can navigate through the pages in the report by either clicking on the pages listed below, or by using the keyword search tool below to find specific information within the annual report.-
 1
1 -
2
-
3
-
4
-
5
-
6
-
7
-
8
-
9
-
10
-
11
-
12
-
13
-
14
-
15
-
16
-
17
-
18
-
19
-
20
-
21
-
22
-
23
-
24
-
25
-
26
-
27
-
28
-
29
-
30
-
31
-
32
-
33
-
34
-
35
-
36
-
37
-
38
-
 39
39 -
 40
40 -
 41
41 -
 42
42 -
 43
43 -
 44
44 -
 45
45 -
 46
46 -
 47
47 -
 48
48 -
 49
49 -
 50
50 -
 51
51 -
 52
52 -
 53
53 -
 54
54 -
 55
55 -
 56
56 -
 57
57 -
 58
58 -
 59
59 -
60
-
61
-
62
-
63
-
64
-
65
-
66
-
67
-
68
-
69
-
70
-
71
-
72
-
73
-
74
-
75
-
76
-
77
-
78
-
79
-
80
-
81
-
82
-
83
-
84
-
85
-
86
-
87
-
88
-
89
-
90
-
91
-
92
-
93
-
94
-
95
-
96
-
97
-
98
-
99
-
100
-
101
-
102
-
103
-
104
 |
 |

integration initiatives in Phase 1. The Company continues to engage in activities to enable the Company to
implement its “go to market” strategy in its new markets and to complete the conversions of all the remaining
systems into one platform (Phase 2). The Company incurred operating expenses and capital expenditures of
$1.5 million and $6.4 million, respectively, in 2010 related to the commencement of these Phase 2 initiatives.
The Company currently expects to incur operating expenses and capital expenditures of approximately $90
million and $60 million, respectively, in 2011 related to these Phase 2 initiatives.
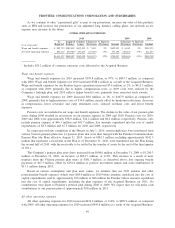
INVESTMENT INCOME/OTHER INCOME (LOSS), NET / INTEREST EXPENSE /
INCOME TAX EXPENSE
($ in thousands) Amount
$ Increase
(Decrease)
% Increase
(Decrease) Amount
$ Increase
(Decrease)
% Increase
(Decrease) Amount
2010 2009 2008
Investment income . . . . . . . . . . . . . . . . . . . $ 6,848 $ 563 9% $ 6,285 $ (9,833) (61%) $ 16,118
Other income (loss), net . . . . . . . . . . . . . . $ 13,690 $ 54,817 133% $ (41,127) $(35,957) NM $ (5,170)
Interest expense. . . . . . . . . . . . . . . . . . . . . . $521,820 $143,606 38% $378,214 $ 15,580 4% $362,634
Income tax expense . . . . . . . . . . . . . . . . . . $114,999 $ 45,071 64% $ 69,928 $(36,568) (34%) $106,496
Investment Income
Investment income for 2010 improved $0.6 million to $6.8 million, as compared with 2009, primarily due
to a $3.0 million gain associated with cash received during 2010 on our previously written-off investment in
Adelphia, partially offset by a decrease of $1.8 million in income from short-term investments of cash and cash
equivalents, due to lower short-term investment rates, and a decrease of $0.6 million in equity earnings.
Investment income for 2009 declined $9.8 million, or 61%, to $6.3 million as compared with 2008
primarily due to reduced equity earnings of $4.2 million and a decrease of $5.6 million in income from short-
term investments of cash and cash equivalents, as higher cash balances were more than offset by significantly
lower short-term investment rates.
Our average cash balances were $304.7 million, $318.0 million and $177.5 million for 2010, 2009 and
2008, respectively.
Other Income (Loss), net
Other income (loss), net for 2010 improved $54.8 million to $13.7 million as compared with 2009,
primarily due to the loss on early retirement of debt of $45.9 million recognized in 2009. 2010 reflects a $4.5
million gain on a life insurance policy settlement and an increase of $2.2 million in settlement of customer
advances.
Other income (loss), net for 2009 declined $36.0 million to $(41.1) million as compared with 2008,
primarily due to premiums paid on the early retirement of debt of $45.9 million in 2009, partially offset by
increased litigation settlement proceeds of $3.8 million.
Interest Expense
Interest expense for 2010 increased $143.6 million, or 38%, to $521.8 million, as compared with 2009,
primarily due to higher average debt levels in 2010. Interest expense for 2010 included $143.2 million
associated with the assumed debt from the Transaction. Our composite average borrowing rate as of December
31, 2010 and 2009 was 8.04% and 7.85%, respectively.
Interest expense for 2009 increased $15.6 million, or 4%, to $378.2 million as compared with 2008,
primarily due to higher average debt levels and interest rates in 2009. Our composite average borrowing rate as
of December 31, 2009 as compared with the prior year was 31 basis points higher, increasing from 7.54% to
7.85%.
48
FRONTIER COMMUNICATIONS CORPORATION AND SUBSIDIARIES