Frontier Communications 2010 Annual Report Download - page 10
Download and view the complete annual report
Please find page 10 of the 2010 Frontier Communications annual report below. You can navigate through the pages in the report by either clicking on the pages listed below, or by using the keyword search tool below to find specific information within the annual report.-
 1
1 -
 2
2 -
 3
3 -
 4
4 -
 5
5 -
 6
6 -
 7
7 -
 8
8 -
 9
9 -
 10
10 -
 11
11 -
 12
12 -
 13
13 -
 14
14 -
 15
15 -
 16
16 -
 17
17 -
 18
18 -
 19
19 -
 20
20 -
 21
21 -
22
-
23
-
24
-
25
-
26
-
27
-
28
-
29
-
30
-
31
-
32
-
33
-
34
-
35
-
36
-
37
-
38
-
39
-
40
-
41
-
42
-
43
-
44
-
45
-
46
-
47
-
48
-
49
-
50
-
51
-
52
-
53
-
54
-
55
-
56
-
57
-
58
-
59
-
60
-
61
-
62
-
63
-
64
-
65
-
66
-
67
-
68
-
69
-
70
-
71
-
72
-
73
-
74
-
75
-
76
-
77
-
78
-
79
-
80
-
81
-
82
-
83
-
84
-
85
-
86
-
87
-
88
-
89
-
90
-
91
-
92
-
93
-
94
-
95
-
96
-
97
-
98
-
99
-
100
-
101
-
102
-
103
-
104
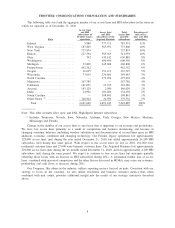
 |
 |

2010 2009
As of or for the year ended
December 31,
Residential Customer Metrics:
Customers...................................................... 3,445,193 1,254,508
Revenue (in 000’s). . . . . . . . . . . . . . . . . . . . . . . . . . . . . . . . . . . . . . . . . . . . . . $1,678,551 $ 899,800
Products per residential customer* —Frontier Legacy . . . . . . . . . . . . . 2.60 2.52
Average monthly residential revenue per Customer—Frontier
Legacy....................................................... $ 60.31 $ 57.62
Percent of customers on price protection plans—Frontier Legacy . . 58.4% 53.3%
Customer monthly churn—Frontier Legacy . . . . . . . . . . . . . . . . . . . . . . . 1.33% 1.47%
Business Customer Metrics:
Customers...................................................... 343,823 140,763
Revenue (in 000’s). . . . . . . . . . . . . . . . . . . . . . . . . . . . . . . . . . . . . . . . . . . . . . $1,621,349 $ 858,460
Average monthly business revenue per Customer—Frontier Legacy $ 511.33 $ 485.72
* Products per residential customer: primary residential voice line, HSI and video products have a value of 1.
Long distance, Frontier Peace of Mind, second lines, feature packages and dial-up have a value of 0.5.
Network Architecture and Technology
Our local exchange carrier networks consist of central office hosts and remote sites, primarily equipped
with digital switches. The outside plant consists of transport and distribution delivery networks connecting our
host central office with remote central offices and ultimately with our customers. We own fiber optic and
copper cable, which have been deployed in our networks and are the primary transport technologies between
our host and remote central offices and interconnection points with other incumbent carriers.
Our fiber optic and copper transport system is capable of supporting increasing customer demand for high
bandwidth transport services. We are currently upgrading our network with the latest Internet Protocol
Transport and routing equipment, Reconfigurable Optical ADM Add/Drop Multiplexers (ROADM) transport
systems, Very High Bit-Rate DSL (VDSL) HSI equipment, and Voice over Internet Protocol (VOIP) switches.
These systems will support advanced service such as Metro Ethernet, Dedicated Internet, Multiprotocol Label
Switching (MPLS) transport, and VOIP. The network is designed with redundancy and auto-failover capability
on our major circuits.
As of December 31, 2010, approximately 91% of the households in our legacy territories had access to our
broadband products. As of December 31, 2010, approximately 70% of the households in the acquired
Territories had access to broadband products.
Rapid and significant changes in technology are expected in the communications industry. Our success
will depend, in part, on our ability to anticipate and adapt to technological changes. We believe that our
existing network architecture will enable us to respond to these technological changes efficiently. In addition,
we anticipate reducing costs through the sharing of best practices across operations, centralization or
standardization of functions and processes, and deployment of technologies and systems that provide for greater
efficiencies and profitability in order to drive improvement in profitability.
Competition
Competition in the communications industry is intense. We experience competition from many
communications service providers, including cable operators offering video, data and VOIP products, wireless
carriers, long distance providers, competitive local exchange carriers, Internet providers and other wireline
carriers. We believe that as of December 31, 2010, approximately 90% of the households in our territories
could receive voice, data and video services from a competitive provider.
The lingering impact of the severe contraction in the global financial markets that occurred in 2008 and
2009 and the subsequent recession has affected residential and business customer behavior. Customers have
9
FRONTIER COMMUNICATIONS CORPORATION AND SUBSIDIARIES